Continue to Site

Eng-Tips is the largest engineering community on the Internet

Intelligent Work Forums for Engineering Professionals

  • Congratulations GregLocock on being selected by the Eng-Tips community for having the most helpful posts in the forums last week. Way to Go!

Converting Spectrum to Lower Resolution 3

271828

Structural
Mar 7, 2007
2,257
Greetings all! I have what is probably a silly question, but I'm having a hard time figuring it out, so here goes.

I have an acceleration magnitude spectrum with a constant resolution of 0.125 Hz (call this Spectrum #1). These are steady-state vibrations in a building, mostly from mechanical units, so there are a few fairly isolated peaks. I need to convert Spectrum #1 to an equivalent spectrum (Spectrum #2) with a 0.5 Hz resolution.

Would it be reasonable to do this based on energy, as described below?

For example, consider the 5 Hz center frequency.
  1. In Spectrum #2, this bin goes from 4.75 Hz to 5.25 Hz.
  2. In this same range of frequencies, Spectrum #1 has points at 4.75 Hz, 4.875 Hz, 5 Hz, 5.125 Hz, and 5.25 Hz.
  3. The energy of each Spectrum #1 point would be the acceleration magnitude squared times 0.125 Hz. (Half that at 4.75 Hz and 5.25 Hz because the other half goes into the adjacent 4.5 Hz and 5.5 Hz bins, respectively.)
  4. Sum the energy for the five points to get E at 5 Hz.
  5. The Spectrum #2 magnitude at 5 Hz would be sqrt(E / 0.5 Hz).
Is that an OK way to do this? If not, is there a better way? Any advance would be appreciated.

271828
 
Last edited:
Replies continue below

Recommended for you

That all depends on what units your spectrum is in. Depending on the method used to analyse it some options are g, g^2, g/sqrt(Hz) or g^2/Hz. The correct generic approach is to turn it into energy per bin (frequency line), sum the bins, and then convert back into the desired units. This is commonly done to turn FFTs into 1/3 octave plots, and so on.

What programming language are you using?

A very good check is to determine the RMS of the original waveform and then check that at each stage the energy remains the same.
 
Last edited:
Thanks Greg.

Both spectra are in g, scaled to RMS. Simple FFT magnitudes.

Octave / Matlab
 
Last edited:
That means the energy in each bin is NOT a PSD, you can just add the squares up, and square root the sum. This of course will make your peak higher, but the energy of the total signal stays the same.
 
et voila, probably got mistakes, haven't done this for years, no hanning or corrections

Code:
%spectrum271828

%Greg Locock
%29 Dec 2025
%v .1
%To do


%Dependencies
%none
%Changelog

clc;
clear;
close all

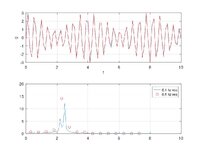
%make a time signal
t = 0:.125:10;
x = sin(2.1*pi*2*t) + 2*sin(2*pi*2.35*t);

%plot it and add some random noise
subplot(2,1,1)
plot(t,x)
grid on
xlabel('t')
ylabel('g')
hold on
x=x+.1*randn(1,length(x));
plot(t,x,'r')
(sum(x.*x))

%fft it
spec=fft(x)/sqrt(length(x)/2); %scaled to give = energy
f=(1:length(x)))/10;
spec(f>4)=0; %take the rubbish out
subplot(2,1,2)
plot(f,abs(spec))
grid on
hold on
sqspec=abs(spec).*abs(spec);
(sum(sqspec))

%Now add the bins together
for ii=1:15
  firstbin=(ii-1)*5+1;
  lastbin=firstbin+4;
  spec2(ii)=sqrt(sum(sqspec(firstbin:lastbin)));
  f2(ii)=(f(firstbin)+f(lastbin))/2;
end
plot(f2,abs(spec2),'ro')
legend ('0.1 hz res', '0.5 hz res')


%and check the energy
sqspec2=abs(spec2).*abs(spec2);
(sum(sqspec2))
 
Last edited:
updated the code above with a less inaccurate legend (0.1, not 0.125)
 
Greg, thank you very much for your help. Thanks especially for the reminder to check the total energy. I learned quite a bit. The resulting plots:

PlotsFromGregsMFile.jpg
 

Part and Inventory Search

Sponsor