Continue to Site

Eng-Tips is the largest engineering community on the Internet

Intelligent Work Forums for Engineering Professionals

  • Congratulations KootK on being selected by the Eng-Tips community for having the most helpful posts in the forums last week. Way to Go!

Discrepancies in results compared to other software and hand calculations

Status
Not open for further replies.

mendacem

Civil/Environmental
Sep 4, 2024
5

Hello everyone,

This might seem like a basic question, but I'm having trouble figuring out what's wrong with my setup.

I need to create a simple runoff model, so I set up one subbasin and input rainfall data into HydroCAD. The basin area is approximately 0.35 square miles, with a Curve Number (CN) of 88.29 and a time of concentration of 48 minutes, which I calculated by hand using Tc
= ((0.0136*L^0.8/S^0.5*(1000/CN-9))^0.7/60 - the SCS equation.​

I'm new to this software; I usually work on hydraulic modeling, but now I need to handle the hydrology as well. I've done the hand calculations, and for a 24-hour storm with the catchment data mentioned above, I calculated the 100-year peak flow to be around 130 cfs. I also checked with StreamStats (which I know isn't a formal reference and can't be used in modeling, but I wanted to cross-check), and the 100-year peak flow is around 120 cfs. These values align pretty well.

The project is in New Jersey, so I used the SCS Type III 24-hour distribution. My client insists on using software capable of calculating this type of runoff. Since it seemed straightforward, I borrowed a HydroCAD license and also tested it with SSA, which I already had. To my surprise, when I set up the basic model (assuming that area, CN, and rainfall depth are the most important parameters affecting the results), the peak flow came out to be around 800 cfs. This seems vastly overestimated for an area of this size.

Both software packages gave me approximately the same results, which suggests they're calculating something differently then I do. However, after going through the manuals, FAQs, and explanations on the differences in results, I still can't understand where the problem lies.

I'd appreciate any insights or advice on what I might be doing wrong. I'm not attaching the model because there's not much to see—it's just a simple subbasin with area, CN, rainfall data, and the SCS Type III 24-hour distribution set up.

Thanks in advance.
 
Replies continue below

Recommended for you

Good morning,
Using the simple rational method of 0.35 sq miles (224 Acres), 100-yr rainfall intensity of 7.29 in and a weighted Cn of 88.2, with a TC input of 48 minutes ;calculates to 754.42 cfs @ 12.64 hrs using HydroCAD stormwater modeling software.

Please see attached Hydrograph.

Hope this helps pinpoint the error in the formula/calcs.


A few things to consider, in my opinion is 224 Acres at a weighted Cn of 88+ Those contributing numbers appear significantly high when comparing to average residential outputs etc. So for the 224 acres or 0.35 sq miles, your weighted Cn is over 88? When calculating the peak flow for the 1000-year storm, you should most definitely be using a rainfall depth overt 7"
In my opinion and per multiple calculations, the peak flow of approx 750 cfs is much more reasonable than 100 cfs.

Just a though Good luck.
 
Hey, thanks for talking the time to answer and running the model.

Yes, when I run it in HydroCad I get similar results like yours but as I said I need to use SCS type III 24 hour storm and the rainfall depth is actually 8.9 inches. The CN number checks out, it is high because it is mostly Urban land complex soil type.

But still my question is why is there such big difference when hand calculating the peak and the peaks they got on stream stats versus the ones that the software provide?
 
So the equations I used are S= 1000/CN-10 , Q= (P-0.2)^2/(P+0.8S) as an runoff depth, time to peak Tp=0.6*Tc, Qpeak= 484*A*Q/Tp

I have a concern because I have insight in a bridge project about a mile away from mine, which has similar curve numbers (CN) and the same rainfall depth. However, its drainage area is 2.6 square miles, approximately nine times larger than my catchment area. The accepted flow for that project, according to DEP and FEMA, is around 1,100 cfs, while the flow I calculated using HydroCAD for my project is 800 cfs. Does this make sense to you?

Once again is streamstat really that far off?
 
As you have found, those equations do not reflect a complete runoff calculation using the SCS method, as implemented in HydroCAD and other programs. You have used the equations for generating a single unit hydrograph, but this must be applied to each rainfall burst and not the total rainfall depth. There is no easy way to estimate final results by the UH procedure. You have to run the full analysis with a suitable program, such as HydroCAD

As for stream stats, results depend on the rainfall conditions you select. Also, stream stats considers routing effects that may be significant for your area, but are neglected when you do a single subcatchment analysis without considering the intricacies of the watershed. I suspect the stream stats rainfall values are also lower than the recent event you are evaluating.

Peter Smart
HydroCAD Software
 
So, I should rely on the software data? That actually works better for me, but I just wanted to double-check to make sure I'm not overestimating my calculations. Is the time of concentration accurate? I checked it using two different formulas and got around 48 minutes with both, the average slope of the basin is around 2.8% so 0.028, and the longest flow path is 4544 feet. Since those are the only three key parameters (Tc, CN, and area) needed to generate runoff in HydroCAD, it's important to input them carefully.

In your expert opinion, when working with stormwater runoff, do these results seem reasonable considering the size of the area and the amount of runoff being produced?
 
Since you have confirmed that at two separate programs provide a similar result for the SCS method, yes, I would trust that result. So this comes down to a matter of how you have chosen to model the area in question.

Give the size of the the watershed, I suspect that treating it as a single uniform subcatchment may not be accurate. A question has also been raised about the relatively high CN value of 88. I also question whether the CN is uniform across the entire area, or a matrix of different CN values. With 224 acres there are also likely to be variations in terrain, including defined drainage paths, that make the single-subcat model less accurate. This probably accounts for some of the difference you are seeing with Stream Stats, with the remaining difference being due to different rainfall scenarios.

I suspect you need to do a more detailed analysis of the subject area, rather than treating it as a single, homogeneous area.


Peter Smart
HydroCAD Software
 
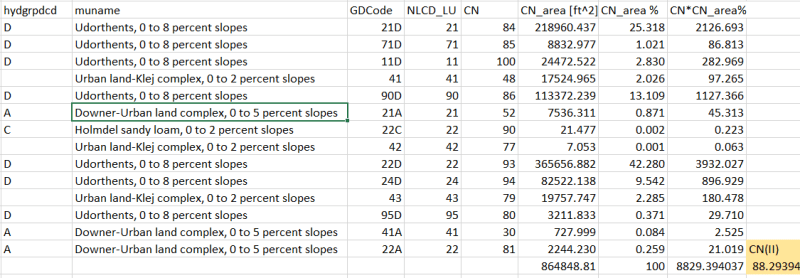
Hey again, thanks for taking the time to help me out. I'm attaching the CN calculations and data broken down by area. As you can see, the values aren't uniform across the basin. I did detailed calculations and area percentages, but since, as I mentioned, it's primarily an urbanized area, I'm getting high CN values.

I understand the more detailed approach you're suggesting, but there's only one stream draining into the lagoon, though there might be other minor drainage paths. While I get that the approach could yield more accurate results, I don't think it would significantly affect the peak flows. I've previously used a single basin approach, even for larger areas, and it worked well.

However, I believe I found the issue: it looks like I miscalculated the time of concentration (Tc). Using the SCS Lag Time Equation ( and converting lag time to Tc, I get 7.7 hours, which gives me a peak flow around 150 cfs—close to the results from StreamStats and my manual calculations. But a Tc of 7.7 hours seems high. Using the Kirpich formula, I get a Tc of 20 minutes, which is also what SSA calculates. I understand that Kirpich is basic formula and can't be used in every situation, but still this is a huge difference.

I'm having trouble making sense of these results because the values are so different, making it hard to decide which one to use. I guess the SCS method fits well with the NRCS runoff method, but is there a specific rule or guideline for choosing a particular equation for Tc or lag time? Is there a one equation that works well in every case when working with basins less then 5 square miles in size?


CN_calcs_vg4jli.png
 
You would find it much easier to do the Tc calcs in HydroCAD. It's also an easy way to compare the different Tc options. There shouldn't be as much of a difference as you're running into with your hand calcs.

The most common approach, as recommended by NRCS, is to use a segment of sheet flow for the upland areas, followed by a segment or shallow-concentrated flow, and then a segment of channel flow. If you don't have that level of detail you can use the CN/Lag method. Click Help on each screen for full details.

Peter Smart
HydroCAD Software
 
Status
Not open for further replies.

Part and Inventory Search

Sponsor