Continue to Site

Eng-Tips is the largest engineering community on the Internet

Intelligent Work Forums for Engineering Professionals

  • Congratulations KootK on being selected by the Eng-Tips community for having the most helpful posts in the forums last week. Way to Go!

Evaluating The Integrity Of Official Climate Records 41

Status
Not open for further replies.

zdas04

Mechanical
Jun 25, 2002
10,274
There is a 53 minute presentation at Evaluating The Integrity Of Official Climate Records from Steve Goddard (who starts by describing his qualifications which seem to be rock solid) that shows many high quality examples of how dramatically the climate data has been modified. One interesting observation is that approximately 50% of U.S. weather stations have been taken out of service in the last 30 years (primarily rural) and the data is "estimated" based on the remaining stations which are primarily urban (and most have been "corrected" for heat island effects). His data shows clearly exactly how the climate data has been manipulated (always in the same direction). It is worth 53 minutes to see if your credibility button gets pushed.

[bold]David Simpson, PE[/bold]
MuleShoe Engineering

In questions of science, the authority of a thousand is not worth the humble reasoning of a single individual. Galileo Galilei, Italian Physicist
 
Replies continue below

Recommended for you

"What you are praising is like taking 1000 data points at 1 record per second and then taking another 1000 data points at 1 record per day and then adding all 2000 points together and dividing them by 2000 to get an "average". "
"What a stupid argument. "

Ditto.

TTFN (ta ta for now)
I can do absolutely anything. I'm an expert! faq731-376 forum1529
 
applying a correction to PM data to make it consistent with AM data doesn't make it "better", it makes it "consistent" so you can work with the two datasets.

however, the correction is an estimate ... it may be rationally derived, or semi-rationally, or simply made up.

To overwrite PM data with AM adjustments (what I think we're doing) is to me close to heresy (to return to the religious theme we've had running).

another day in paradise, or is paradise one day closer ?
 
The data is NOT overwritten. The software that does the processing pulls data files, processes the data, and ships out a new, blended data. The original files are still there, otherwise, the software would need to be essentially rewritten every day, which it obviously is not.

TTFN (ta ta for now)
I can do absolutely anything. I'm an expert! faq731-376 forum1529
 
For all those that are skeptical of the adjustments to USHCN, did you read Menne et al 2009, Karl et al 1986/7/8 or Vose et al 2003 (full papers available for free online) prior to forming your opinion?

You may treat this question literally or rhetorically.

I’m also not insinuating that you should agree with any or all of those papers, far from it. However, it would certainly be peculiar to be skeptical of the adjustments to USHCN without having read about the adjustments to USHCN. One might say it would be the difference between being skeptical and “skeptical”.

It’s why I find it odd that Heller/Goddard talked for an hour about the results of “manipulations” to USHCN without mentioning TOB, the actual adjustment methods to USHCN or any of the papers that discuss the adjustments.

It’s why I find it odd that zdas04 started a thread about “manipulations” to USHCN without being aware of TOB, the actual adjustment methods or any of the papers that discuss the adjustments.

It’s almost as if they looked at the old data sets, that showed no warming, which they liked, and then looked at the updated data sets, that show warming, which they disliked, had no idea where the difference came from but concluded there must be “manipulation” to “fake” the warming. But certainly a necessary step, if one was actually skeptical (and asked themselves, What Would Galileo Do?), would be to actually review the adjustments (i.e. read the papers), demonstrate where, exactly, the “manipulation” and “faking” are taking place in the current methodology (in doing so, you might need to explain the errors in all the other consilient data sets) and show the results after correcting for the “manipulation” and “faking” in the current methodology. However, this step appears to have been skipped.

One might say it pushes my “credibility button”.

(Note: one notable example of this step NOT being skipped was Berkeley Earth Surface Temperature)
 
One should be skeptical of any data adjustments. Having said that, the proper way to show the data is both adjusted and non-adjusted, with a foot note of why the data needed to be adjusted. This is so the reader understands what one is trying to show.

By showing only the adjusted numbers it looks like something is being hidden, or someone is being dishonest.

Having never met Galileo, I have no idea what he would do.

I actually have more of a problem with drawing conclusions without clear and concise data.

 
not sure why the last set of posts got deleted, since they seemed pretty boring, overall.

"One should be skeptical of any data adjustments. Having said that, the proper way to show the data is both adjusted and non-adjusted, with a foot note of why the data needed to be adjusted. This is so the reader understands what one is trying to show."

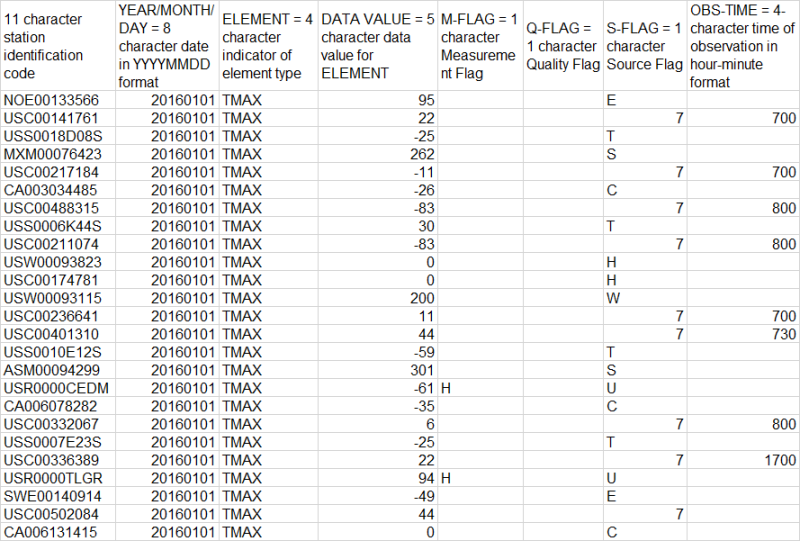
This is really not that doable. Each point on the typical temperature graph corresponds to thousands of individual values that are blended into that single point. Attached is a TINY portion of the TMAX data from Jan 1 2016, and the salient features are:
> OBS-TIME is all over the place, so this is where the TOB correction as to made, but Jan 1 data consists of over 12000 measurements, so individually notating them would be insane and not particularly readable
> Oddball temperature values all over the place, the likely errors
> I think these measurements are actually in ºC, but other locations and older values are in ºF, and thousands upon thousands of values that have to put into the same units
> Q-FLAG values indicate specific types of quality errors, but there's obviously values that are clearly not correct, but aren't flagged

As mentioned above, 12000+ data values for 1 day. Excel choked on the data file before it even completed Jan 11. So that's 1 million values in 11 days, and about 31 million values in a year. Not all are raw measurements or even temperatures, though; the S-FLAG entries denote specific sources that summary data, and are treated differently from raw data. Attached is the record from 1776, which is obviously more manageable, 1464 entries; I had originally thought they were US, but I forgot that the file came from the Global HCN, and the sources appear to be European.
TMAX_zuvjn6.png


TTFN (ta ta for now)
I can do absolutely anything. I'm an expert! faq731-376 forum1529
 
does that mean some sensors are showing 262 deg, 200 deg, 301 deg ?

are all data in the same scale ? Celsius, Kelvin, Fahrenheit, Rankine ?

another day in paradise, or is paradise one day closer ?
 
Apparently. But you can see that even in this extremely tiny section, there are already many values that need to be corrected or eliminated. There's no scale where 200 makes sense on Earth in a habitable location

TTFN (ta ta for now)
I can do absolutely anything. I'm an expert! faq731-376 forum1529
 
and many we don't know the time taken, nor how consistent they are (same time every day ?).

maybe we don't have "data", just a number of numbers ?

another day in paradise, or is paradise one day closer ?
 
"maybe we don't have "data", just a number of numbers ?

Not sure what you mean; the data are labeled as TMAX, other fields not included in the screencap are TMIN, TOBS (which is what I should have filtered for) etc.:

Element_mkpmw5.png

ELEMENT is the element type. There are five core elements as well as a number
of addition elements.

The five core elements are:

PRCP = Precipitation (tenths of mm)
SNOW = Snowfall (mm)
SNWD = Snow depth (mm)
TMAX = Maximum temperature (tenths of degrees C)
TMIN = Minimum temperature (tenths of degrees C)

The other elements are:

ACMC = Average cloudiness midnight to midnight from 30-second
ceilometer data (percent)
ACMH = Average cloudiness midnight to midnight from
manual observations (percent)
ACSC = Average cloudiness sunrise to sunset from 30-second
ceilometer data (percent)
ACSH = Average cloudiness sunrise to sunset from manual
observations (percent)
AWDR = Average daily wind direction (degrees)
AWND = Average daily wind speed (tenths of meters per second)
DAEV = Number of days included in the multiday evaporation
total (MDEV)
DAPR = Number of days included in the multiday precipiation
total (MDPR)
DASF = Number of days included in the multiday snowfall
total (MDSF)
DATN = Number of days included in the multiday minimum temperature
(MDTN)
DATX = Number of days included in the multiday maximum temperature
(MDTX)
DAWM = Number of days included in the multiday wind movement
(MDWM)
DWPR = Number of days with non-zero precipitation included in
multiday precipitation total (MDPR)
EVAP = Evaporation of water from evaporation pan (tenths of mm)
FMTM = Time of fastest mile or fastest 1-minute wind
(hours and minutes, i.e., HHMM)
FRGB = Base of frozen ground layer (cm)
FRGT = Top of frozen ground layer (cm)
FRTH = Thickness of frozen ground layer (cm)
GAHT = Difference between river and gauge height (cm)
MDEV = Multiday evaporation total (tenths of mm; use with DAEV)
MDPR = Multiday precipitation total (tenths of mm; use with DAPR and
DWPR, if available)
MDSF = Multiday snowfall total
MDTN = Multiday minimum temperature (tenths of degrees C; use with
DATN)
MDTX = Multiday maximum temperature (tenths of degress C; use with
DATX)
MDWM = Multiday wind movement (km)
MNPN = Daily minimum temperature of water in an evaporation pan
(tenths of degrees C)
MXPN = Daily maximum temperature of water in an evaporation pan
(tenths of degrees C)
PGTM = Peak gust time (hours and minutes, i.e., HHMM)
PSUN = Daily percent of possible sunshine (percent)
SN*# = Minimum soil temperature (tenths of degrees C)
where * corresponds to a code
for ground cover and # corresponds to a code for soil
depth.

Ground cover codes include the following:
0 = unknown
1 = grass
2 = fallow
3 = bare ground
4 = brome grass
5 = sod
6 = straw multch
7 = grass muck
8 = bare muck

Depth codes include the following:
1 = 5 cm
2 = 10 cm
3 = 20 cm
4 = 50 cm
5 = 100 cm
6 = 150 cm
7 = 180 cm

SX*# = Maximum soil temperature (tenths of degrees C)
where * corresponds to a code for ground cover
and # corresponds to a code for soil depth.
See SN*# for ground cover and depth codes.
TAVG = Average temperature (tenths of degrees C)
[Note that TAVG from source 'S' corresponds
to an average for the period ending at
2400 UTC rather than local midnight]
THIC = Thickness of ice on water (tenths of mm)
TOBS = Temperature at the time of observation (tenths of degrees C)
TSUN = Daily total sunshine (minutes)
WDF1 = Direction of fastest 1-minute wind (degrees)
WDF2 = Direction of fastest 2-minute wind (degrees)
WDF5 = Direction of fastest 5-second wind (degrees)
WDFG = Direction of peak wind gust (degrees)
WDFI = Direction of highest instantaneous wind (degrees)
WDFM = Fastest mile wind direction (degrees)
WDMV = 24-hour wind movement (km)
WESD = Water equivalent of snow on the ground (tenths of mm)
WESF = Water equivalent of snowfall (tenths of mm)
WSF1 = Fastest 1-minute wind speed (tenths of meters per second)
WSF2 = Fastest 2-minute wind speed (tenths of meters per second)
WSF5 = Fastest 5-second wind speed (tenths of meters per second)
WSFG = Peak gust wind speed (tenths of meters per second)
WSFI = Highest instantaneous wind speed (tenths of meters per second)
WSFM = Fastest mile wind speed (tenths of meters per second)
WT** = Weather Type where ** has one of the following values:

01 = Fog, ice fog, or freezing fog (may include heavy fog)
02 = Heavy fog or heaving freezing fog (not always
distinquished from fog)
03 = Thunder
04 = Ice pellets, sleet, snow pellets, or small hail
05 = Hail (may include small hail)
06 = Glaze or rime
07 = Dust, volcanic ash, blowing dust, blowing sand, or
blowing obstruction
08 = Smoke or haze
09 = Blowing or drifting snow
10 = Tornado, waterspout, or funnel cloud
11 = High or damaging winds
12 = Blowing spray
13 = Mist
14 = Drizzle
15 = Freezing drizzle
16 = Rain (may include freezing rain, drizzle, and
freezing drizzle)
17 = Freezing rain
18 = Snow, snow pellets, snow grains, or ice crystals
19 = Unknown source of precipitation
21 = Ground fog
22 = Ice fog or freezing fog

WV** = Weather in the Vicinity where ** has one of the following
values:

01 = Fog, ice fog, or freezing fog (may include heavy fog)
03 = Thunder
07 = Ash, dust, sand, or other blowing obstruction
18 = Snow or ice crystals
20 = Rain or snow shower


TTFN (ta ta for now)
I can do absolutely anything. I'm an expert! faq731-376 forum1529
 
Been there, but I don't remember seeing a weather station.
 
Cranky,
They are kind of hard to spot, and over half of the rural stations have been taken out of service (hard to find budget money to maintain a thermometer, it is all going to modelers and politicians) and are being estimated today. So it may or may not still be there.

[bold]David Simpson, PE[/bold]
MuleShoe Engineering

In questions of science, the authority of a thousand is not worth the humble reasoning of a single individual. Galileo Galilei, Italian Physicist
 
I don't believe it would be in town, and if it was, and the amount of changes that have taken place, I would not trust it.

But with crop rotation, it may also not be that trustworthy outside of town either.

Like many rural towns, it has grown. It may not look like it, but adding one trailer park can change the local heat island. With corn prices up like they have been, I would guess that some irrigation has been added around Concordia. So the dynamics of the area have changed without any AGW.

Don't get me wrong, it just might not be anything that someone who is not local can know about.
 
my point was how can you rely on such "data" ? the values are all over the place (three obvious errors, well maybe not if the readings are in 1/100th deg), but not all the fields are filled in (like "time of day" which seems to be so critical that we have to correct old data).


another day in paradise, or is paradise one day closer ?
 
My point is there are many other factors that can change the local temps.
 
rb1957,
The legend does say that the values of temperature, such as they are, are in tenths of degrees C.
 
yeah, so i stuttered on the "0" ... not nice to hi-light another's afflictions ...

another day in paradise, or is paradise one day closer ?
 
cranky108 said:
So the dynamics of the area have changed without any AGW.

That would certainly be a problem if that was the only data source being used, but that single station is being aggregated with many other ones to look at GLOBAL trends. Would you claim the standard atmosphere model is wrong because you measured a different temperature and pressure locally on a given day?
 
If you used only a single station, than your confidence factor of your numbers would be very bad. A single station can not be used for any global trends.

Having said that local trends, over several locations can skew the outcome of a regional study. The change from growing wheat to growing corn, with the addition of irrigation can change the results of measurments over several states. (I don't know how much I will admit, but I can see the potential). And all of this would be predicated on the price of corn, which is being grown because of the renewable nature.

On the other hand, many small towns still remain small towns, but have grown just as the nations population has grown.

Many roads that were dirt, and now paved. Many wind breaks in the mid states have been cut down because the USDA is now recommending it, where in the past it was recommending planting wind breaks.

My intent was not to muddle up the discussions, but more to show that there is more in play in the real world than just CO2. That areas have changed, and just can't be assumed to be the same over the years.

Without a strong indicator either way, one could argue it was something else.
 
Status
Not open for further replies.

Part and Inventory Search

Sponsor