Eng-Tips is the largest engineering community on the Internet

Intelligent Work Forums for Engineering Professionals

  • Congratulations waross on being selected by the Eng-Tips community for having the most helpful posts in the forums last week. Way to Go!

Extracting an acceleration at a given frequency from a PSD

Status
Not open for further replies.

waIkman

Mechanical
Apr 21, 2021
8
CH
Hello everyone,

I am having trouble with PSD curves, it's clearly not my cup of tea and maybe someone can help me on this.

I have 2 different vibration cases that I'd like to compare, given as follows:

1- Acceleration 45m/s^2 / displacement 19mm / Frequency 11Hz -> To me this is a simple sine wave.

2-
PSD_i0e4i3.png

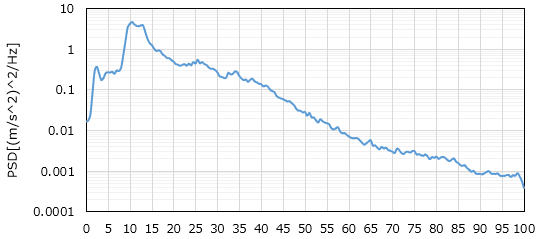
note: the x values are in Hz

I don't really know what I can extract from that PSD to compare it to the first case. I've heard that I should use Mile's equation to extract an acceleration value at a given frequency, but I thought this was correct at resonant frequencies and when we know the damping factor which I don't.

In the best world I'd like to know if the acceleration at 11Hz in the n°2 case is lower or higher than the one in the first case.

Thank you in advance for any help,

Have a great day.
 
Replies continue below

Recommended for you

It's been awhile but I'll give it a shot. You need to know some stuff about how the PSD was generated. There's the "normalizing" factor which seems to be different for different software PSD calculators. Your data looks like a vertical acceleration of a car or truck spindle. That's what I used to work with. You can get the RMS value of an acceleration at a particular frequency by:

1) Multiplying the PSD value at that frequency by delta F (frequency resolution of the PSD)
and then,
2) Taking the square root of that value.

For the type of work we used to do, we'd typically sample data at 204.8 points/sec and used frame lengths of 5 seconds. That gives you an FFT length of 1024 points and a frequency resolution, Delta F, of 204.8/1024 = .2 Hertz.

For your plot it looks like, at 11 hertz, the PSD shows about [(4.5 m/s^2)^2]/hz. So, using the numbers we used to use, the RMS value would be
accel = (4.5*.2)^.5 = .95 m/s^2​

Hmm, that's only about .1 g's which seems real low for a vertical spindle acceleration. Hopefully others will chime in with their input!
 
Miles' eq is appropriate when the PSD is flat within one octave on either side of the natural frequency - which doesn't seem to be the case for most of the freq range here.

The Miles' eq is used to calculate the response due to an input, not to correlate a input to another input, which seems to be your question here..

Of course, to find the response and to generally understand the effect of this input, you'd have to know more about your system (such as fn, damping or Q).

That said, just looking the the units (g^2/Hz), it looks like you're at around 5g^2 at 11Hz, this is roughly 2.2g or half of your ~4.5g pure sine case...

PSDs are oftentimes reported as Grms, which can have peaks at 3-4x the rms value...

There is obviously energy at other frequencies. Are these not concerning to you? Is your fn at 11Hz, and so that's what your test is designed around? Or are you just picking off the highest freq?

I'm sure other, more experienced folks could chime in.

Edit: Brian is correct that the PSD energy corresponds to bins depending on your sampling, which are usually much smaller that the 1Hz I used above for simplification sake... I'd guess there's not a big distinction between 11Hz and 11.2Hz input here..?
 
I took the liberty of digitizing your curve. The Excel file is attached. Looks like it's almost exactly 4 g^2/Hz, so you can pick your bandwidth, which looks to be around 0.5 Hz
psd_dig_si2sde.gif


TTFN (ta ta for now)
I can do absolutely anything. I'm an expert! faq731-376 forum1529 Entire Forum list
 
Hello everyone,

Thank you for the explanations.

I asked for the values table as well as the normalizing values.

I got told the window size was 2048 points and the sampling frequency is 1024Hz, so that comes out as a Delta F of 0.5Hz which is what is indeed in the values they gave me.

I am reading 4.81 m/s^2/HZ at 10.5Hz as the peak acceleration so that would give me 1.55m/s^2 at that frequency ?? it really seems very low.

Question... Shouldn't I be multiplying that result by the frequency itself ? I am asking this because the Y axis is in (m/s^2)^2/HZ

Thank you very much and have a great day.
 
No, it's per delta-hz (bin size), so 0.5hz.

I'm a little curious how this relates to the real world, and why you'd ignore neighboring frequencies bc of an arbitrary sampling rate?

By picking a different sampling rate (and therefore bin size) you'd end up with a different magnitude at this particular frequency...
 
That makes sense thank you for the confirmation.

I am not ignoring the other frequencies. It's just that our customer changed his requirement and went from an 11Hz sine wave to the PSD attached and I wanted to better understand the difference at that particular frequency. It seemed to be a bizarely big difference in requierement...

In the end we will run the complete tests anyway.

Thank you everyone and have a great day.
 
I'm not understanding ...

the units are given as m/sec^2 not "g" ... g^2/Hz would be roughly 1/100th of m/sec^2

or has the OP misread the data ('cause I see the two are dimensionally the same)

another day in paradise, or is paradise one day closer ?
 
I took IRstuff's points and integrated them, so you could compare the total Grms input.

Looks to be about 5.6grms overall, with ~4g of that falling between 5-20Hz.

Edit: Woops, I assumed the units were in G^2... this would be a much lower input as rb1957 said...
 
 https://files.engineering.com/getfile.aspx?folder=46015afb-2419-4020-af1f-3134d514d14b&file=psd_-_Copy.xlsx
Status
Not open for further replies.

Part and Inventory Search

Sponsor

Back
Top