Continue to Site

Eng-Tips is the largest engineering community on the Internet

Intelligent Work Forums for Engineering Professionals

  • Congratulations waross on being selected by the Eng-Tips community for having the most helpful posts in the forums last week. Way to Go!

FEA Linear Natural Frequency vs Physical Sine Sweep 2

Status
Not open for further replies.

healingfire

Mechanical
Mar 31, 2014
7
I am doing some FEA analysis on an assembly in NX.

I just have a few questions which I thought you might have the answers to. I performed a linear natural frequency FEA analysis on the assembly structure with the relevant constraints. I also performed a physical sine sweep using a shaker to obtain the natural frequencies. In the Physical sine sweep, I had to decide on which direction I want the shaker to vibrate and mount the accelerometers accordingly however for the FEA analysis i dont have to indicate the shake axis in the software.

Can you tell me what are the differences in the two natural frequencies obtained (one by FEA analysis, the other by physical sine sweep) and can they be compared since in the physical sine sweep the shaker is only vibrating in one direction.

Regards,
Harsh.
 
Replies continue below

Recommended for you

Dear Harsh,
Modal Eigenvalue analysis, ie, natural frequency analysis (SOL103), let you to compute the natural frequencies of the structure, it shows how the structure vibrates "naturally" according to its mass and stiffness and under the current boundary conditions, not any loading is considered. The NX NASTRAN solver will give you the fundamental modes of vibration of the equipment in Hz, as well as the mass participation factors for every mode, and also you can animate the different mode shapes. All this information is important to know in advance the structural behaviour of the equipment in order to prevent possible resonant problems in service.

The same way that you perform a physical sine sweep test in the shaker table, you can run a SINE VIBRATION MODAL FREQUENCY SWEEP using NX NASTRAN to obtain the response of the equipment under an excitation, just the excitation of acceleration vs. frequency that you define in the physical test, OK?. This analysis is know as modal frequency response (SOL111), and is part of the NX NASTRAN Structured Dynamic solution Sequences (SOLs 107 through 112), also know as enforce motion analysis.

Frequency response analysis is used to compute structural response to steady-state oscillatory excitation. Examples of oscillatory excitation include rotating machinery, unbalanced tires, and helicopter blades. In frequency response analysis the excitation is explicitly defined in the frequency domain. Excitations can be in the form of applied forces and enforced motions (displacements, velocities, or accelerations).

Modal frequency response analysis (SOL111) uses the mode shapes of the structure (previously computed) to uncouple the equations of motion (when no damping or only modal damping is used) and, depending on the number of modes computed and retained, reduce the problem size. Both of these factors tend to make modal frequency response analysis computationally more efficient than direct frequency response analysis. Because modal frequency response analysis uses the mode shapes of a structure, modal frequency response analysis is a natural extension of normal modes analysis.

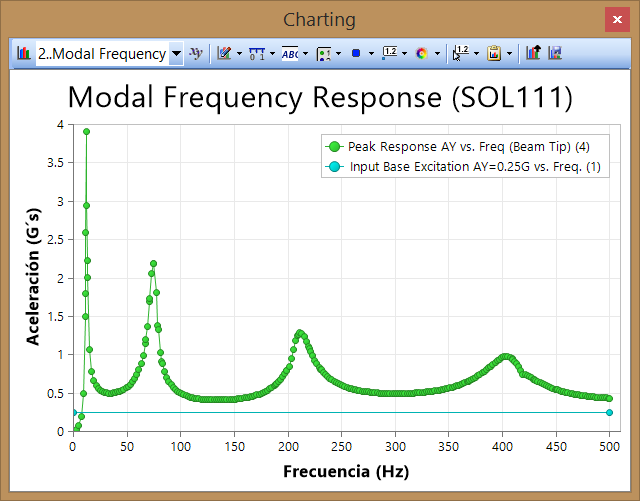
If you want to learn more about modal frequency response take a look to my post in the following address, this is done with FEMAP + NX NASTRAN but the procedure is similar with NX AdvSim. In the picture you have supperposed the excitation of a contactnt acceleration AY=0.25G with the response of acceleration one point of the structure in the frequency range 0-500 Hz.


ay_output_freq_response_xyplot.png


Best regards,
Blas.

~~~~~~~~~~~~~~~~~~~~~~
Blas Molero Hidalgo
Ingeniero Industrial
Director

IBERISA
48011 BILBAO (SPAIN)
WEB: Blog de FEMAP & NX Nastran:
 
Dear Blas,

Thank you so much for your reply. I now understand that these two methods are different, one taking account of mass,stiffness and boundary conditions while another one taking into account of forced loading and that they both can be simulated in NX.

Just a conceptual question regarding vibration in general.

Is there any way that these two can be related? For example, lets say the eigenvalue natural frequency (from fea) is about 254 Hz will resonance in a physical sine sweep ( e.g sweep from 20-2000Hz) also occur at around that value (254hz) in any direction the accelerometer is placed?


Regards,
Harsh.
 
Dear Harsh,
We are talking about the same, if the mass, stiffnes and boundary conditions applied in the Finite Element Model are correctly and comparable with those found in the equipment mounted in the Shaker Test Machine, then the eigenvalue modal results obtained by FEA will be similar to those obtained by the shaker test, not doubt at all. If not, then check your FEA model, the most difficult is to properly constraint the FE model, to define mass correctly, if the equipment is bolted in the shaker machine, then you will have to define correctly this attachment in the FEA model, not to over-stiff (or under-stiff) everything, OK?.

The advantage of FEA is that everything is VIRTUAL, if you know what to do then no limits to your imagination, the difficult is to do things correctly, to capture the real life accurately is the target, then the user experience & knowledge on FEA is critical!!.

Best regards,
Blas.

~~~~~~~~~~~~~~~~~~~~~~
Blas Molero Hidalgo
Ingeniero Industrial
Director

IBERISA
48011 BILBAO (SPAIN)
WEB: Blog de FEMAP & NX Nastran:
 
Dear Blas,

So to confirm what you are saying, comparing values from SOL103 (lets say natural frequncy = 254Hz) to physical sine sweep on shaker ( eg accelerometer mounted in x-axis, shaker x-axis ) the resonance should also occur at around 254Hz if I did my FEA correctly?

I have not done SOL111 as it is slightly more complicated to set up.

Regards,
Harsh
 
Dear Harsh,
In theory the natural frequencies of an estructure measured in the shaker test lab should be the same, not matter if you excitate in the X, Y or Z axis by an enforced motion of acceleration vs. frequency. The diferences should be in the response obtained: if not any mode shape exist in the direction of the excitation, then not any DAF (dynamic amplification factor) exist, and the XYplot of the response is flat. In the above picture, the frequency at peak values of the response are COINCIDENT with the values of the natural frequencies of the structure. Then to avoid dynamic amplifications of the response, a good design is the one that the FIRST natural frequency (this is the FUNDAMENTAL frequency, the one with maximum energy) fall outside of the range of the excitation.

If the frequency of the excitation is the same as the frequency of the first mode and both have the same deformed shape, and no damping exist, then the structure gets destroyed (displacement response results goes to infinite), this is what we know as resonance. Damping takes an important role here, and is the most difficult thing to achive correctly in a FE model for Dynamic analysis.

By the way, the value of f1=256 Hz belongs to a SUPER-STIFF structure ...

Best regards,
Blas.

~~~~~~~~~~~~~~~~~~~~~~
Blas Molero Hidalgo
Ingeniero Industrial
Director

IBERISA
48011 BILBAO (SPAIN)
WEB: Blog de FEMAP & NX Nastran:
 
Dear Blas,

Yes I got a frequency of 254Hz in my FEA analysis. Then when I did a physical sine sweep ( in longitudinal direction) with accelerometer placed on a certain place in my model I got a frequency of around 250Hz. When I repeated the physical sine sweep (in lateral direction) and placing the accelerometer in another direction i got a value of about 150Hz. I have attached the appropriate pictures as PNG file (first one in longditunal direction) and second one is (lateral direction) with this reply.

You can see that the black line is the control response and the green line is the measure response.

What could be the reason for the difference?
 
 http://files.engineering.com/getfile.aspx?folder=69c56ab0-6528-4161-8831-49d9ad057393&file=Longitudinal_axis_of_structure.PNG
Dear Blas,

Just to clarify again, that the two graphs I obtained were from real physical tests on my structure* placed on shaker table.

Regards,
Harsh.
 
Dear Harsh,
To obtain the resonant frequencies (ie, the natural frequencies of the structure) using the Lab test machine you need to excite the structure in the three directions, first in X axis, then Y axis and finally the Z axis. The frequencies at the maximum responses at each test will give you the resonant frequencies of the structure.

Best regards,
Blas.

~~~~~~~~~~~~~~~~~~~~~~
Blas Molero Hidalgo
Ingeniero Industrial
Director

IBERISA
48011 BILBAO (SPAIN)
WEB: Blog de FEMAP & NX Nastran:
 
Status
Not open for further replies.

Part and Inventory Search

Sponsor