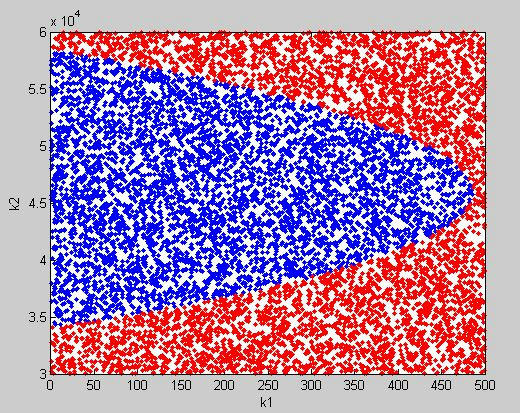
I have the following code:
clc
clear all
d1=1.6256;
d2=0.77;
d3=0.815;
b=11;
m=967.44;
Ig=9759.19;
V=73.05555;
rho=1.225;
dCL=10;
a11= (1/m)*(k1+k2);
a12= (1/m)*((k1*d3)-(d3*(k1-k2))-(0.5*dCL*rho*(V^2)*d1*b));
a21= (1/Ig)*(d3*(k2-k1));
a22= (1/Ig)*(d3*(k1+k2)-(0.5*dCL*rho*(V^2)*d1*b)*(d1-d3)-d3);
A1=[0,1,0,0;-a11,0,-a12,0;0,0,0,1;-a21,0,-a22,0];
eig(A1);
A=((a11+a22)/2)
B=((a11*a22)-(a12*a21))
I am trying to find the values of k1 and k2 (between 0 and 7e6) that give the results of B>A^2. There is likely to be multiple values so if I could plot them in to a contour plot of k1 vs k2 then it would help.
Can somebody suggest how this would be possible?

