Good morning,
As a student Marine Engineer and Electro Technical Officer I have to complete a thesis. This is a report focused on answering a research question. The engineering team onboard has suggested that I research the feasibility of installing frequency drives on the hydrophore skid.
The current hydrophore is a setup with two 1500L buffer tanks under 7.5 bar pressure, with three multistage self-priming pumps, capable of a total of 30m3/h. These pumps are used (not at the same time, alternating to keep the running hours equal) to fill the pressure vessel.
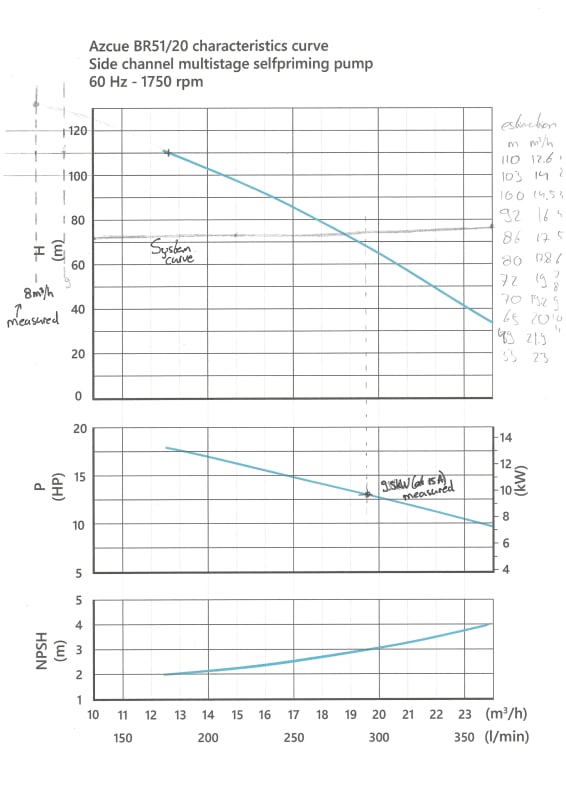
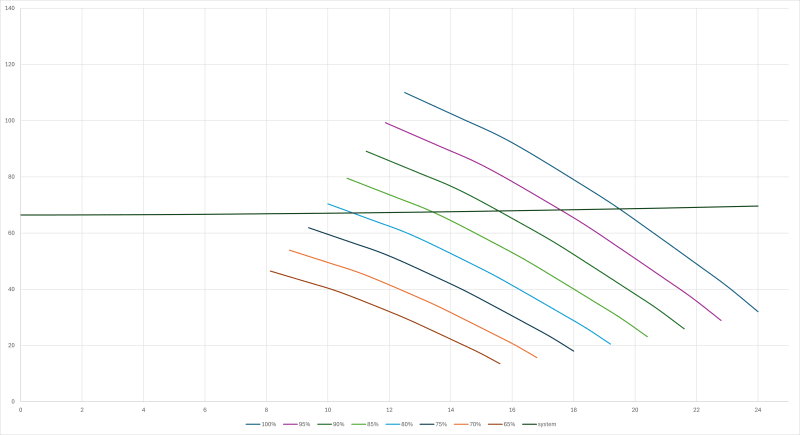
I have taken the pump curve from the datasheet of the pump and plotted this in Excel, together with the calculated (according the affinity laws) pump curves with lower speed. I have also calculated the system curve. The static head is high, as the pumps turn on at 6.5 bar and stops at 7.5 bar. The friction head is quite low because it is a small pumping system (around 20m of pipe with various fittings etc, pump suction height equal to the tank suction height and the discharge is also on the same level), resulting in a flat system curve.
But now I measured and calculated the average flow of the pump around 11 m3/h during a filling cycle, which is way of the crossing point of the system curve and 100% operating curve.
I hope you could explain me why this is.
Kind regards,
Sam
As a student Marine Engineer and Electro Technical Officer I have to complete a thesis. This is a report focused on answering a research question. The engineering team onboard has suggested that I research the feasibility of installing frequency drives on the hydrophore skid.
The current hydrophore is a setup with two 1500L buffer tanks under 7.5 bar pressure, with three multistage self-priming pumps, capable of a total of 30m3/h. These pumps are used (not at the same time, alternating to keep the running hours equal) to fill the pressure vessel.
I have taken the pump curve from the datasheet of the pump and plotted this in Excel, together with the calculated (according the affinity laws) pump curves with lower speed. I have also calculated the system curve. The static head is high, as the pumps turn on at 6.5 bar and stops at 7.5 bar. The friction head is quite low because it is a small pumping system (around 20m of pipe with various fittings etc, pump suction height equal to the tank suction height and the discharge is also on the same level), resulting in a flat system curve.
But now I measured and calculated the average flow of the pump around 11 m3/h during a filling cycle, which is way of the crossing point of the system curve and 100% operating curve.
I hope you could explain me why this is.
Kind regards,
Sam