mattijs.stu
Industrial
- Aug 14, 2020
- 4
Hi,
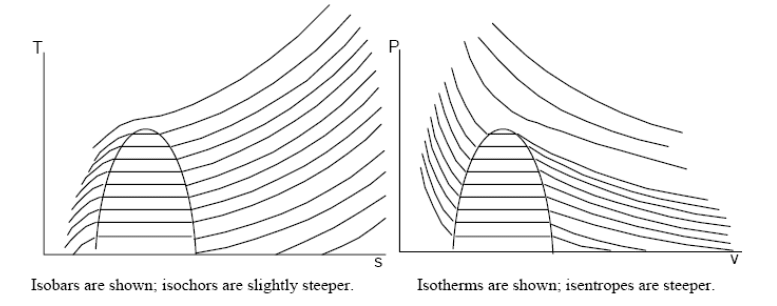
I am trying to make a program, that is going to draw a t-s diagram with the isobars of my choosing.
i'm able to calculate the isobar for the vapour dome region and superheated region. However the subcooled liquid zone is troubling me.
First picture the isobar stops and follows the saturated liquid line down to the left?
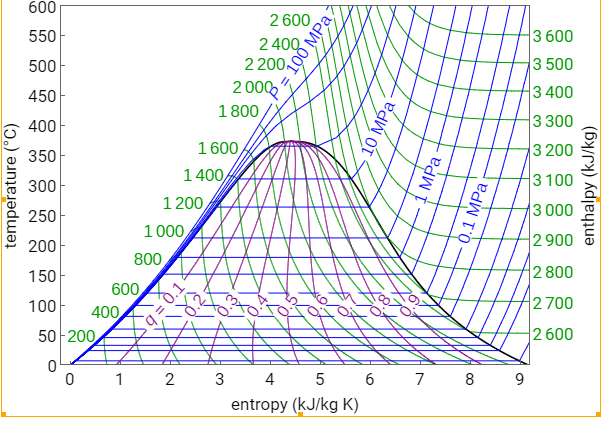
Second picture it does not lay on-top of the saturated liquid line.
Using free online IAPWS R7-97 calculators, i am getting graphs where the isobar is on top of the saturated liquid line. I am now not sure what is exactly correct.
If it would be rather like the second picture, how can i define these points. Lets say i know the temperature and pressure, what calculation could tell me the entropy?
best regards
Matt
I am trying to make a program, that is going to draw a t-s diagram with the isobars of my choosing.
i'm able to calculate the isobar for the vapour dome region and superheated region. However the subcooled liquid zone is troubling me.
First picture the isobar stops and follows the saturated liquid line down to the left?
Second picture it does not lay on-top of the saturated liquid line.
Using free online IAPWS R7-97 calculators, i am getting graphs where the isobar is on top of the saturated liquid line. I am now not sure what is exactly correct.
If it would be rather like the second picture, how can i define these points. Lets say i know the temperature and pressure, what calculation could tell me the entropy?
best regards
Matt
") ) could be very useful, do you have a list of all the functions it has etc? And possible what units it requires and gives as answers?
) could be very useful, do you have a list of all the functions it has etc? And possible what units it requires and gives as answers?