Eng-Tips is the largest engineering community on the Internet

Intelligent Work Forums for Engineering Professionals

L-pile deflection to depth chart 1

Status
Not open for further replies.

stillfan1

Structural
Oct 21, 2019
3
0
0
US
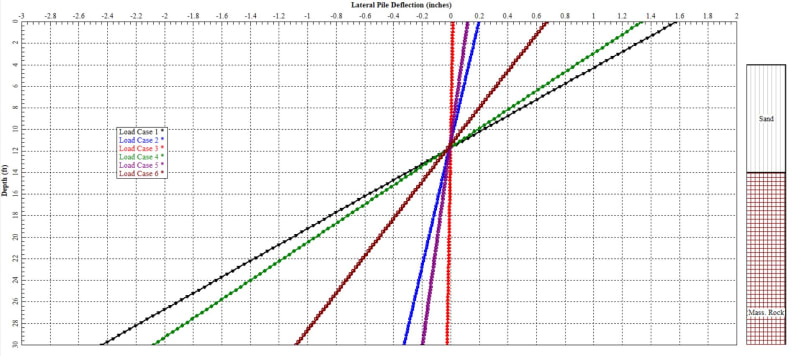
I have a reinforced drilled concrete pile that is free at the head and embedded into sandstone for 16 ft. When I view the Pile deflection to depth chart it is giving me a negative deflection of 2.4 in how is that possible with rock. I have attached the image. I would have suspected it to respond more in a fixes manner at the rock level. See attached image. Any thoughts?
Screenshot_2020-10-14_173126_zlqeeh.jpg
 
Replies continue below

Recommended for you

Looks very rigid. I'd expect some curvature differences along the length of the shaft.

What diameter pier?

But you're right that does look 'off' - you'd expect the point of rotation to be in the rock layer. I guess we'd need to evaluate the input data and or geotech info to offer much real advice.

What do the shear and moment graphs look like?
 
Looks like some sort of error to me. And that is on multiple levels: you'd think the lines would have more curve to them. (Assuming we are talking about soil surrounding the pile....which is why someone would use L-Pile in the first place)

And if the rock is displacing that much.....you need a deeper socket.

Modeling sockets can get tricky in L-Pile.....sometimes you get a "shear spike".
 
Agree with WARose's comments. Ask more experienced person for modeling mistakes, the property does not seem right.
 
Have you used the strong rock model? It has a brittle failure point which causes progressive failure of the rock down the pile and is not realistic.

Post the plot of ground reaction vs depth, and the rock p-y curve.
 
Status
Not open for further replies.
Back
Top