Eng-Tips is the largest engineering community on the Internet

Intelligent Work Forums for Engineering Professionals

Lateral Force on Pile 2

Status
Not open for further replies.

HarshanaM

Structural
Jun 22, 2015
7
0
0
LK
I could use some help on this and thanks in advance!

So, I have been given the task of analysing the effects of a lateral force acting on a
existing pile foundation in a project
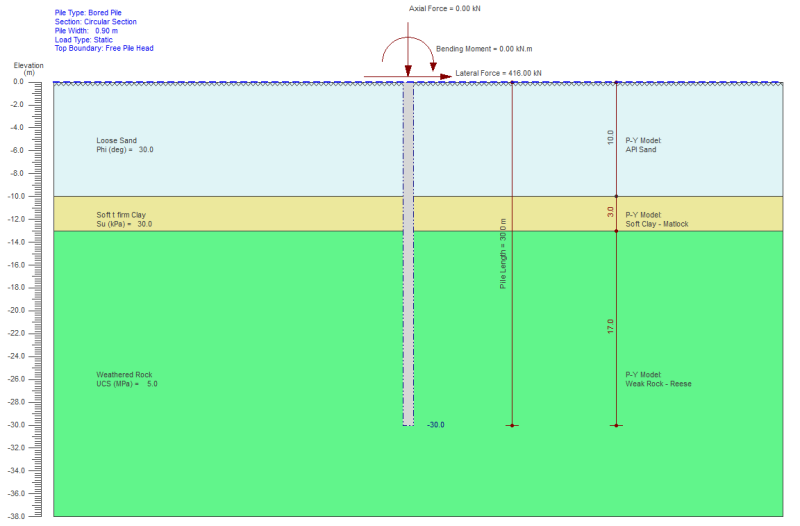
The contractor is preparing to prop the temporary retaining wall on to a pile at about 45 degree angle. I want to estimate the stress generated at the point where the prop connects with the pile given that the surrounding soil generates a lateral resistance to the applied force. I can calculate the stress applied however in order to model the effect from soil I'm confused how to obtain the soil spring parameters. The soil is loose sand upto about 10 meters and a small peat layer is also present. After that its weathered rock.

Please give me clues on this.
Thanks
 
Replies continue below

Recommended for you

Hi, it appears that the behavior of the pile under lateral loading would be governed by the top 10 m thick loose sand. You can refer to the p-y curves from API or Reese for the soil spring stiffness, however, it is generally non-linear. For this kind of problem, we usually use some lateral pile analysis programs to determine the pile deflection, bending moment and shear force. It is quick and easy. If you can provide some more details such as pile length, diameter, loads and water table location, I will look into the problem in more details for you.
 
Hi GeoBo,

Thanks a lot for your quick response. This is my first ever post in the forum and I'm really excited that people are actually very helpful. So thanks again.

I calculated the load. The load acting on the pile is 416 kN and at about 1m below the pile top. Pile is a 900mm pile embedded in to fractured rock of about a 30m total length. Water table is at the same level of the prop (1m below piile top). I'm looking in to Bowles' method but it's a bit conservative.

BR
HarshanaM
 
Based on your information, the ground profile and the loads are roughly shown in the figure below:
EngTips_-_Ground_Profile_cjdyym.png

The pile deflection and bending moment would look like this:
EngTips_-_Deflection_Bending_zmon6v.png

The p-y curves along the pile length within the loose sand layer are:
EngTips_-_P-y_Curves_wlfhsg.png

This just gives you some feelings about the p-y curves along the pile.
 
Thanks for this. I did a manual calculation of stiffness and assigned springs on SAP2000 and I got similar results. (BM around 1400 kN-m)
Can you kindly let me know which program you used to do this analysis?
 
Low shear force at the pile head doesn't necessarily mean that the resulted maximum bending moment will be low. More importantly, it depends on the soil stiffness around the pile, especially the top 10 m thick loose sand layer for this case. If the stiffness was very low, even a small shear force at the pile head can lead to a large bending moment in the pile.

The results I attached in my previous reply are obtained with adopting API sand model for the top loose sand with the water table at the layer top (I used the program of PileLAT 2014). The maximum bending moment is about 1100 kN.m. Noted that if the API sand model is replaced with Reese sand model (just using different p-y models for the top sand layer), then the maximum bending moment resulted is about 1210 kN.m. I also used LPILE program to double check the results and the maximum bending moment from LPILE is 1211 kN.m.
 
I checked it as well with a spreadsheet I created that uses elastic finite elements for the pile and elasto-plastic springs for the soil and the values are within the range that GeoBo provided: maximum bending moment around 1100kNm and pile head horizontal displacement is about 26mm.

I enclose the spreadsheet I created. The VBA code is not very elegant or efficient, and it is not yet fully polished, but it worked in the validation tests. Totally open-source, use it as you wish (and at your own peril...).
 
GeoBo-

You said "More importantly, it depends on the soil stiffness around the pile" - in my experience, you can vary the lateral subgrade modulus by 300% and you will see little effect on induced shear, moment & deflection. You also said "especially the top 10 m thick loose sand layer for this case"- from my analysis, only the upper 4B or so has the most influence on lateral capacity- in this case, the upper 5 m or so. You used p-y curves and I used non linear lateral springs, which allows for soil stiffness to increase or decrease with depth based on soil consistency.

avscorreia-
In your analysis, when you went from node 20 to 21 & again from 26 to 27, you did a large step. As you know, the soil stifffness for example at 10m will not be that different from 10.01 m. In my analysis, I tapered my steps to simulate the entire soil layer in comparison with the upper materials.

Attached are my analysis. Regardless of the computed maximum bending moment, the pier is overstressed in the upper 1.6 m of soils by exceeding its passive resistance. This is a good example of meeting the required lateral deflection but creating a gap in the upper soils. The solution would be to go to 1.0 m diameter and see if you don't exceed the lateral soil pressures.


@FixedEarth
Thank you for your reference. You're totally right regarding the big "jump" in stiffness and maximum lateral force as that is not real at all. However, the depth at which it occurs is at a large distance of the zone that governs the problem so its influence in the problem is negligible.

I reran my calcs with stiffness and passive force values similar to yours and I reach a moment of around 540kNm for a displacement of 10mm. I think that the major difference is in the maximum passive force in the springs that we are allowing to develop in the upper layer. I used the classical formulation, assuming a maximum force of sigma'v * Kp multiplied by 2 diameters (instead of the 3 diameters in the Broms solution), not allowing the top springs to develop any substantial force as the effective stress is rather low. I'm not assuming any cohesion. The differences in the soil stiffness give smaller differences (as expected).
 
avscorreia-

I also did simple analysis to double check my earlier rsults. If you convert the round section to an equivalent square pile and assume uniform lateral spring of SAND and then rotate the pile 90 degrees so that it becomes a beam on elastic foundation problem, we get rough values that are not too far apart. See attached.

 
@FixedEarth

Thanks for your discussion and I think you may overestimate the ultimate lateral resistance of the loose sand layer and this is the reason why the bending moment and deflection from your analyses are significantly less than what we predicted. The ultimate lateral resistance of the loose sand layer depends on the friction angle and effective overburden stress.

Therefore, it would starts from 0 at the layer top (effective overburden stress is zero) and generally increases with the depth. The lateral resistance distribution from your analyses appears constant with the depth within the top 10 m sand layer. For me, it seems that it has been treated as a cohesive soil layer. Results from my analysis are attached below.

EngTips_-_Ultimate_Lateral_Resistance_hhfyuu.png


For the same reason, the actual spring stiffness around the pile within the sand layer also should start as very small value at the layer top and then increases with the depth in the similar pattern as the ultimate lateral resistance. Note that the pile lateral analysis is sensitive to the spring values close to the pile top.
 
GeoBo-

Not sure if we can close the 200% or so gap that exists between us, but I will give a last try. I did a third check using Teng's method of granular soils and came up with 630 kN-m max. moment (see attached). So it seems that 400 to 600 kN-m is what I have found and you are around 1100 kN-m. I suspect the following:

You are using very low lateral subgrade modulus values near the surface which is akin to discounting the lateral capacity in the upper few meters. This will give higher bending moment which may explain our large difference in BM. If you look at Table 16-4 of Bowles 5th ed, he suggests 80,000 kN/m^3 as a minimum value for fine SAND and I used even smaller value than that.

16-4_xasice.jpg


Below is a range of the values that I use in SAND compared with published literature:

Overview_of_Lateral_Subgrade_Modulus_in_Granular_Soils_1_ejshvz.jpg


It was a great discussion and the good thing is that you are on the safe side.


Thanks everyone for your responses/suggestions/solutions. I think bowels method is a bit too conservative however that table is only valid for piles of diameter less than 500mm. And if you consider this problem as a beam on elastic foundation the subgrade reaction you assume should be take approximately 3 times more than that of the vertical reaction. So it will be an underestimation I think. However I realized that mostly it depends on where the plastic hinge forms and what type of soil is present within that region. Anyhow thanks a lot. This was a great discussion.
 
avscorreia, I opened your spreadsheet and I find it practical, but there maybe some definitions problems, at least the definitions I'm familiar with.

In the 'soil properties' section there is a k_soil which is expressed in kN/m[sup]2[/sup]

Is that a k/B value actually or a k's as in In the Bowles' handbook? Ks or Winkler modulus or the CSR Coefficient of subgrade reaction should have a force/lenght[sup]3[/sup] units
Probably by Ks you mean the 'pile lateral' resistance' which is plotted against displacement in the p-y curves, but then its dimension would suggest a soil spring stiffness, which has the dimensions of F/L

also, you plot those values as 'soil stiffness' but I would suggest to change the 'stiffness' definition back to ks, or winkler's modulus, or CSR, since stiffness can be construed in many different ways.

More: is 'spring forces' a spring stiffness (CSR/area)??

Is F_max the plastic treshold?

 
As far as the differences in the above analyses are concerned, if I had a soil investigation profile with reliable soil parameters which would allow me to derive CSR for ecvery layer, then a spreadsheet like the one attached by avscorreia would be preferable (ignoring the fact that a nonlinear model is more accurate than an elastic-plastic model).

I would also double check my results with a p-y nonlinear analysis and see if there are major differences and try to explain them


Mccoy, thank you for the time you spent looking at this spreadsheet. It's invaluable to have another pair of eyes checking our programs.

Regarding your questions:
- The k_soil is the Winkler coefficient multiplied py the pile width (or diameter). In this way, the area spring is converted to a line spring (units kN/m2/m to kN/m/m), constant in each element.
- The spring stiffness plot is, in fact, misleadingly titled "soil stiffness" and it should be something like "soil springs stiffness/element [kN/m/m]". I'll change it accordingly;
- "Spring forces" is divided in two outputs: spring nodal forces (in kN) and spring forces per unit length in the element (kN/m, to compare with the F_max plastic threshold, with units kPa*m).

I have added a new sheet to the workbook that allows for a possible calculation of the relevant soil properties (manually) in order to clarify the nature of the input values. Please don't take much notice to the geotechnical relations used. These are there just to illustrate a possible geotechnical scenario and are based on my experience with some local soils.
 
 http://files.engineering.com/getfile.aspx?folder=b01c1a85-f7d7-4177-a644-0d8d185a5db7&file=LPile_VBA_EP_v1.1.xlsm
I checked your spreadsheets and they are really interesting, but I don't have much experience with laterally loaded piles because I'm a student they are not teaching this (hopefully later at MSc.). Can you tell me what literature should I use to understand this better and what are the used theories? As I saw from this topic, they are quite a lot and the approaches are different as well (linear, non linear).
We don't have the software to solve this problems, so easiest it would be through a spreadsheet, but first I need to understand the theory and what I need to input.

I've seen this py curves in a couple of books, but I don't know how to calculate/plot them though. I assume the method should be a reliable one, as I've seen large differences in moments here. Normally we aim that the moment of resistance is greater than applied moment, is that right? This should ensure us that the pile can take the lateral load.

Thanks in advance

P.S. Can this be used pile groups or only for single piles?
 
@ avscorreia: sorry for the delay in answering but this is an extra busy period. Your spreadsheet is interesting, I would say it needs the name or nickname of its author if you are willing to distribute it. I'm going to check a few things and be back.

 
HArshanaM said:
... And if you consider this problem as a beam on elastic foundation the subgrade reaction you assume should be take approximately 3 times more than that of the vertical reaction. So it will be an underestimation I think. ....

I believe horizontal CSR should be 2 times more than vertical reaction, according to Bowles and other literature (for what the difference is Worth in this problem).

There may be other references I do not know though.

 
Status
Not open for further replies.
Back
Top