Eng-Tips is the largest engineering community on the Internet

Intelligent Work Forums for Engineering Professionals

Looking for the Royal Aeronautic Society Data Sheets from the 1940s.

Status
Not open for further replies.

tomsing

Aerospace
May 19, 2010
48
1
8
US
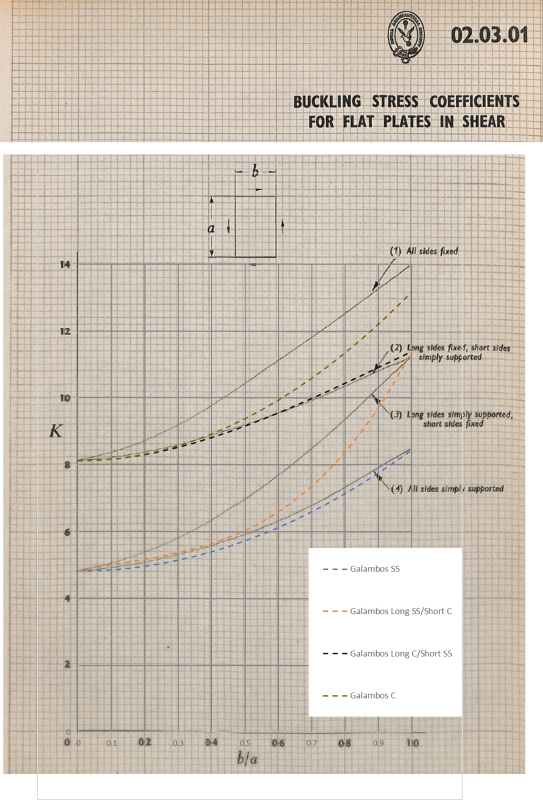
I'm on a bit of a scavenger hunt. I've got a chart of shear buckling coefficients vs aspect ratio for unstiffened rectangular flat panels with different boundary conditions (all sides simply supported, all sides clamped, long sides SS/short sides C, and long C/short SS). One of my colleagues said he tried using some curve fits published in another reference, and noticed a significant difference for the long SS/short C case.

The chart is dated from the 1950s, and references NACA TNs that individually address the all SS and all C cases, Timoshenko's Theory of Elasticity that addresses both of those and long C/short SS, and also the Royal Aeronautics Society Data Sheets for Stressed Skin Structures, which I assume must cover the long SS/short C case, because none of the others do.

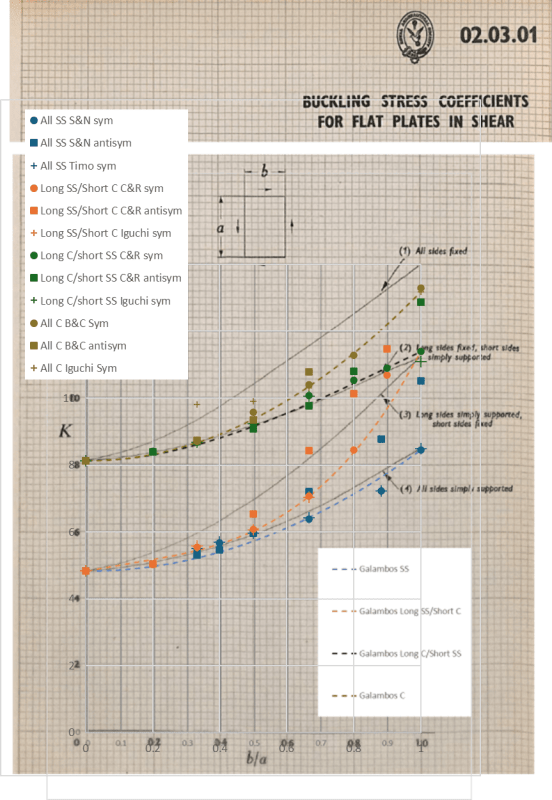
All the references I can actually find for long SS/short C case agree pretty well with each other, and disagree with my chart. Some quick FEMs to spot check things also line up with those references. So I'm pretty confident that my chart is in error, but I'd like to find the RAeS document to see if maybe I'm interpreting a boundary condition incorrectly or something.

I believe the number of the Data Sheet I'm looking for is 02.03.01. The RAeS Data Sheets were replaced by ESDU, and ESDU 71005, Buckling of Flat Plates in Shear, noted that it supersedes 02.03.01. (And ESDU 71005 lines up with all the other references, and doesn't match my chart.)

Hoping one of you might have a copy. Appreciate any help you can provide!
 
Replies continue below

Recommended for you

image001_1_wdrzh4.png


So, the page in my internal manual is dated 1953, so that predates your copy of the data sheet. The copy of the data sheet I got from JHU has individual sections marked as revised over time; section 02.03.01 is marked Issued May, 1941; the overall table of contents for the volume is marked Fifth Issue January, 1957. So it appears that the version of 02.03.01 that I have is the original release in the Data Sheets.

I'm unable to get your Cook and Rockey file; I suspect that the system doesn't like the filename with an ampersand in it.

[ul]
[li]"The case long simple/short clamped agree at at b/a=0 (long plate) and b/a=1 (square plate), but in between the Data Sheet curve is noticeably lower. For example, at b/a=0.6, Galambos gives 7.69 while the Data Sheet is about 6.75."[/li]
[/ul]

Your Data Sheet curve is lower than Galambos? Galambos gives a curvefit for Long SS/Short C (eq 4.27b) of k = 5.34 + 2.31/r - 3.44/r^2 + 8.39/r^3, with r = a/b, for r > 1. So, at b/a = 0.6, r = a/b = 1.67, I get k = 7.30, or K = 7.30 * pi^2/12(1-0.3^2) = 6.59. Are you sure you're reading Galambos correctly?

Not being able to see your attachment, I've got C&R plotted in Bulson (along with Iguchi, which isn't too far off), and k = 7.30 at a/b = 1.67 agrees with that curve. (Here is Bloom and Coffin citing Bulson for the Cook & Rockey curve in Google Books.)

The Data Sheet, at least the original rev (hopefully attached to this post, overlaid with Galambos's curves scaled for nu), gives K = 7.7 at b/a = 0.6. So the Data Sheet that I'm looking at is/was about 17% higher there. I'm seeing agreement at a long panel and a square panel, same as you, but then the Data Sheet is higher in between. (Interestingly, the all sides clamped case in the Data Sheet is well above everything else I've seen, including my internal manual.)

You might be right with your diagnosis that the error derives from failing to include sufficient terms. I would expect that people doing the calculations would have done some convergence checks, though. Although, certainly, we're all only human.
 
Yes, I had the wrong exponent for one of the terms in the Galambos equation for that case. With that correction, the 4 curves in my version of the Data Sheet agree fairly well with the 4 curves using the Galambos equations.

Also, the Cook & Rockey data for the case of long simple/short fixed seems to lie pretty close to both the data sheet and Galambos.

Attached is another try for the results Table from the Cook & Rockey paper. Note that the paper only gives tabulated results, there are no curves.
 
Ok, so somewhere between the first rev of the data sheet in 1941 and third revision of the data sheet in 1963, the long sides simple, short sides clamped case was adjusted, and agrees with Galambos. And apparently also the all sides clamped case was adjusted as well. This is interesting and maybe helpful, thank you! Any chance you could share your copy of the data sheet?

I overlaid the data from Cook and Rockey's table onto the chart; things line up reasonably well with Galambos's curves. One thing that occurs to me is, if the RAS Data Sheet curves were drawn through a limited set of discrete points, maybe they just happened to pick aspect ratios that were near the transitions between one buckling shape and the next, and that pushed the curves up. That may be the rationale I take forward to get my manual updated....

Shear_Buckling_wiwesk.png
 
Status
Not open for further replies.
Back
Top