Frankie183
Mechanical
Hi all!
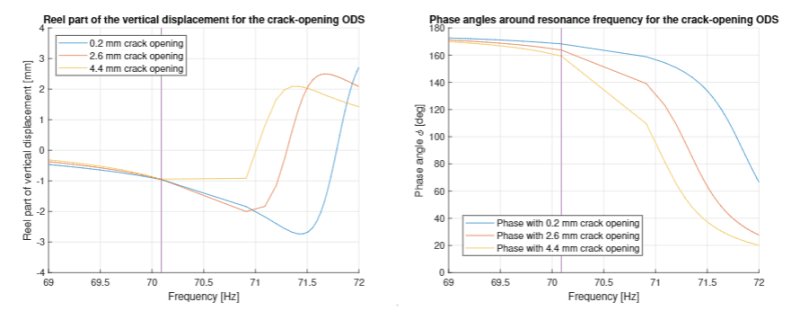
I've got a question, I perform a Steady state analysis and have exported the phase and magnitude graph.
However, there are some massive discontinities in it, while I have a lot of points in the step definiiton between the lower and upper frequency..
Any Idea where these discontinities come from?
Greetings,