Eng-Tips is the largest engineering community on the Internet

Intelligent Work Forums for Engineering Professionals

  • Congratulations waross on being selected by the Tek-Tips community for having the most helpful posts in the forums last week. Way to Go!

Scatter Plot Scales 1

Status
Not open for further replies.

GeoPaveTraffic

Geotechnical
Nov 26, 2002
1,557
0
0
US
Hello all.

Using Excel 2010, version 14.0.7015.1000

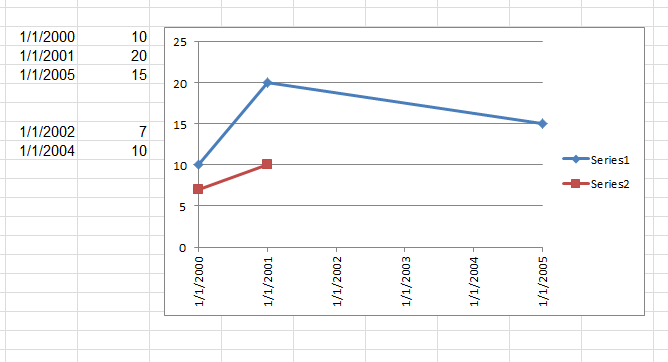
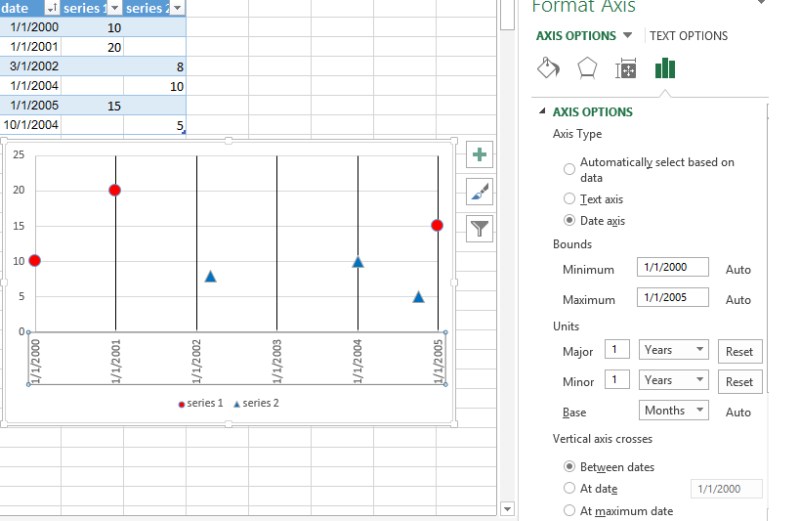
Does anyone know if you can fix the horizontal scale on a scatter plot so that dates appear on a fixed pattern? I have many years of data and I would like the plots to have 1/1/xxxx for the labels. I can get this to work if the data only spans a couple of years by setting the major unit to 365.25, but as the number of years increases this stops working.

Same general question applies to trying to get the first day of the month to appear on the scale.

Anybody found a solution to this?


Mike Lambert
 
Replies continue below

Recommended for you

hi,

Use a LINE Chart with Markers.

Set the Line to No Line.

Format the x-axis Type as Date Axis.

Select Units as Years.

Skip,
[sub]
[glasses]Just traded in my OLD subtlety...
for a NUance![tongue][/sub]
 
Thanks Skip!

I had tried using a line plot several years (versions) ago and that would not maintain the relative position of the data. I see that particular issue has been fixed.

Thanks again.

mike

Mike Lambert
 
Looks like I was a little early in saying this was solved.

So the line graph works fine if all of you data has the same dates. However, I you try to add data that has a different date range, it does not plot correctly.

Here is a quick example of the problem I'm seeing with made up data. As you can see, series 2 is not plotting at the correct location relative to the x (date) axis.

Any ideas?

excel_j73am9.png


Mike Lambert
 
Here's your source data as it should be structured...

[pre]
date series 1 series 2

1/1/2000 10
1/1/2001 20
1/1/2005 15
1/1/2002 7
1/1/2004 10
[/pre]

You implicitly assigned your second table data DATEs to the secondary axis OR your x-axis implicitly changed from a NUMBER axis, which would include DATE, to a CATEGORY axis, which is simply point by point, rather than numerically proportional.

Skip,
[sub]
[glasses]Just traded in my OLD subtlety...
for a NUance![tongue][/sub]
 
Note that Line plots do not really make use of the numerical values of the abcissa; they're solely used as labels.

Part of the problem is that you are using a truncation of the number of days of the year, i.e., a year is actually more like 365.2422 days. However, there may be a simpler way. Since you know the exact mapping of the first day of each month to the timestamp that Excel uses, you can create a table of month lengths that you can use to normalize their actual lengths to a uniform spacing. With some brute-forcing, you could remap the time stamps to look like:

1/1/2000 200008.333
1/1/2001 200108.333
1/1/2005 200508.333


1/1/2002 200208.333
1/1/2004 200408.333

8.333 is 1/12th of 100

TTFN
I can do absolutely anything. I'm an expert!
homework forum: //faq731-376 forum1529
 
Sorry, IRstuff, that is not necessarily true.

In the data I posted there is no data for 2003, yet I have 1/1/2003 on the x-axis with no y-axis value obvoiusly.

The "trick" is to change the x-axis to DATE and the UNIT as YEAR. Solves the 365.25 problem as well.

Skip,
[sub]
[glasses]Just traded in my OLD subtlety...
for a NUance![tongue][/sub]
 
I didn't know that Line Charts worked like XY Charts when the X axis was set to date format.

Actually (at least in XL 2016) if the X axis data is date numbers the chart automatically displays in date format, although if you want to set the label spacing you have to change the axis type from Automatic to Date.

Doug Jenkins
Interactive Design Services
 
I said:
Is it possible to get vertical grid lines on a line chart? I can only find options for the horizontal grid lines.

In 2016 I had to:
Select the chart
Select the Design ribbon under Chart Tools
Click the drop-down arrow on the "Add Chart Element" Icon
Select Grid Lines, then Primary Major Vertical, or Primary Minor Vertical

Doug Jenkins
Interactive Design Services
 
Bottom line: If you want the effect of x-y chart with dates on the x-axis, to properly display irregular units (Month, Year) you need to use a Line Chart with Markers, Series No Line, Date Axis and appropriate Units.

Skip,
[sub]
[glasses]Just traded in my OLD subtlety...
for a NUance![tongue][/sub]
 
Base Units. Good point!

And if you needed to plot Date/Time, the Line Chart would not do the job: You'd need a Scatter Chart, But then Months/Years would not be a display factor.

Skip,
[sub]
[glasses]Just traded in my OLD subtlety...
for a NUance![tongue][/sub]
 
Status
Not open for further replies.
Back
Top