Eng-Tips is the largest engineering community on the Internet

Intelligent Work Forums for Engineering Professionals

  • Congratulations waross on being selected by the Tek-Tips community for having the most helpful posts in the forums last week. Way to Go!

thermal transient problem on Y direction

Status
Not open for further replies.

Daniele1989

Automotive
Feb 15, 2019
19
0
0
IT
Hi all,
i'm trying to performe a 2D transient thermal study, but i don't know how to insert a data.

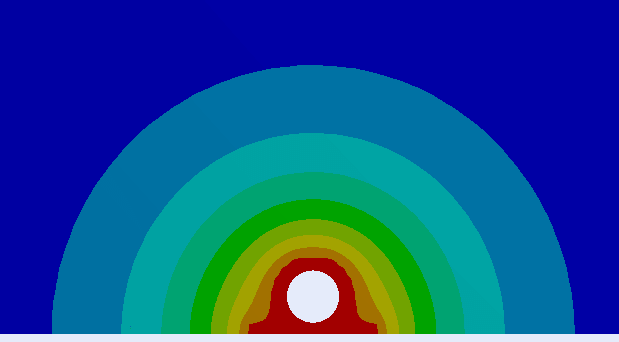
I need to see how heat is exchanged in air, with Y direction (Vertical).


I have a steel component, heat flux in left side of it and air.


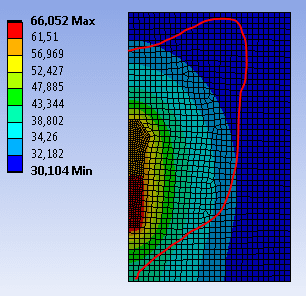
Red line i designed is what i wanted to have:
image_tindbb.png
 
Replies continue below

Recommended for you

You can measure the value of temperature at any point using Probe tool. But if you want to obtain specific shape of contour plot you need to adjust the boundary conditions. But first make sure that it's not just the matter of scale - adjust contour plot data/color range and see if it matches the desired shape.
 
thanks for advice.
I altready tried to adjust colour data to see if it is, but not.

According to you what can i modify on my boundary conditions to get vertical effect?

Thank you
 
Well, with this geometry you would probably have to use some function defining spatially-varying heat flux or temperature boundary condition. But is there any reference that you use - an article with figures of such temperature distributon ? What is the purpose of this analysis and why is this specific shape needed ?
 
If you have a thermal analysis then the heat transfer from solid to air is via conduction which is not the main mode, The main mode of heat transfer is convection, say natural and to model that you will need cfd say fluent. Look for tutorials online on this topic natural convection. Again though not sure what you mean with the read marking, assume you want to measure along this boundary.
 
@FEA_way i need to see how temperature distribution is close to my element and be capable to measure temperature also inside this "Air area". Is possible to have this with another way?
@Erik understood but for me it's important to see a temperature variation in this area.
Thank you all for answer
 
To make things clear - this rectangle is made of steel and you treat it as surrounded by air (using convection heat flux BC), right ?

When it comes to the way you can visualize temperature distribution inside the area marked with red line, you would have to use named selection to hide the rest of the model and see only this part.
 
Can you provide some info and schematic of what you are trying to analyse, because it is very confusing.

Include screenshots of your model/geometry with the different parts and mark out where the air is and where the structure is (also BC and so on). Also what is the purpose of the analysis, and what is that red line.
 
Hi all,
I think it's better to explain with this example:

image_ka0lkf.png


It's also a 2D analysis, in on the bottom there is a resistor where there's applied a tension, the rectangle around is environment that i need to study.
Resistor material is alluminium, and environment is air.
I have a bonded contact.
I need to see in time what temperature i'll have on some points above resistor.

This is the result in temperature:

image_wwyhje.png


Why according to you it doesn't recognize that Y axis is vertical, so i have a different heat sink between Y and X axis?

Thank you
Regards
 
This would require conjugate heat transfer analysis (in CFD solver) to properly account for heat exchange between resistor and air. I think that you still use a model where heat transfer in air domain is via conduction while it should be via natural convection mainly (in the air conduction will happen too though).
 
Status
Not open for further replies.
Back
Top