Mattman83
Mechanical
- Aug 28, 2015
- 5
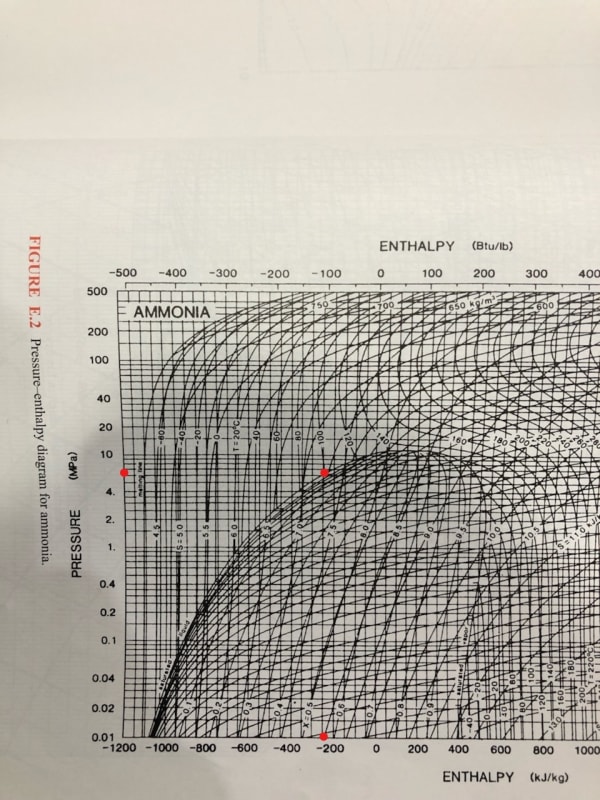
I know this is pretty basic, but I always use tables and am trying to get in the habit of plotting out a vapor compression cycle on a P-h graph. Anyway, I am working with ammonia and the enthalpy results don't seem to match between chart and graph (-200 vs 700 kJ/kg?!). How am I misreading it or what basic principal am I forgetting (my thermo is rusty)?
Looking at 100C saturated liquid:
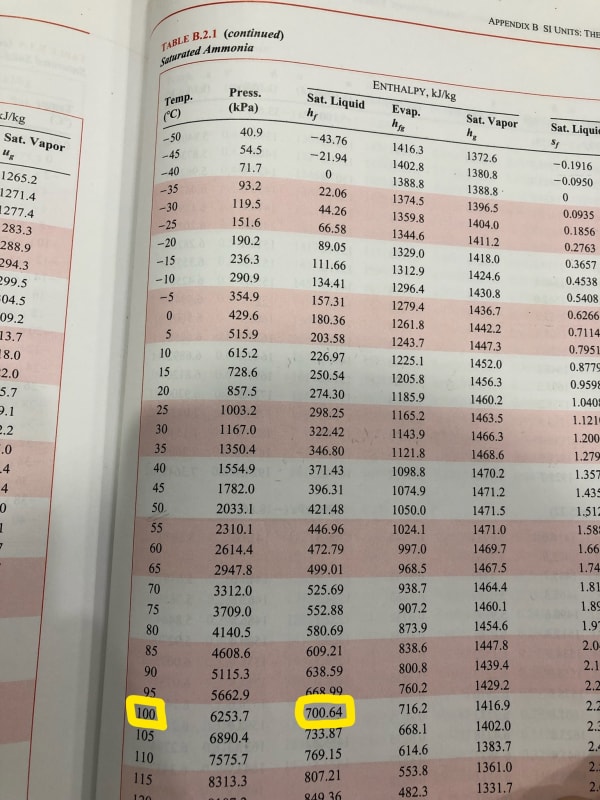
Looking at 100C saturated liquid: