Eng-Tips is the largest engineering community on the Internet

Intelligent Work Forums for Engineering Professionals

Water hammer simulation problem

Status
Not open for further replies.

simonkp

Mechanical
Mar 26, 2024
2
0
0
CL
Hey everyone!
I'm currently learning to utilize a free software called Allievi for calculating water hammer effects in piping systems.
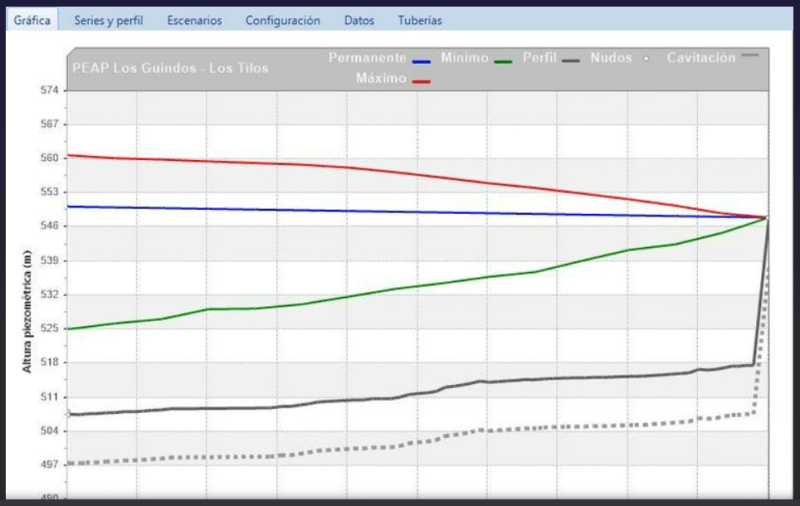
The system itself is quite straightforward. It originates from a water tank and flows towards another tank positioned at a higher elevation (at atmospheric pressure). A pump is installed between these two tanks to raise the water.
The simulation involves shutting off the pump and observing until the water stops oscillating.

Captura_nwcu48.jpg


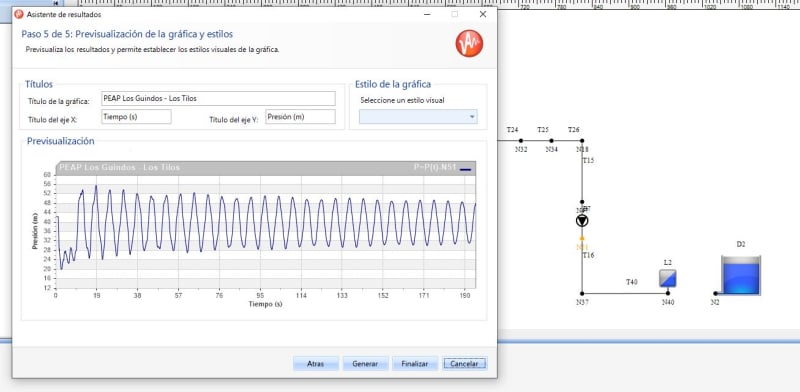
However, the graph I'm observing at the node next to the pump doesn't seem accurate. According to expectations, the amplitude of the pressure wave should diminish over time, correct? So, I'm curious about why there's an increase in the amplitude of the wave.

Any insights or suggestions would be greatly appreciated.

Thank you!
 
Replies continue below

Recommended for you

Got a better diagram?

Lengths?

Size?

Valves, non return valves?

Remember - More details = better answers
Also: If you get a response it's polite to respond to it.
 
Broken VFD?

Elevations
L2 What is that?
The tank looks disconnected from L2.
Pump data?
Flow rate?
Pipe Material

No program documentation? User Manual. Nada?


--Einstein gave the same test to students every year. When asked why he would do something like that, "Because the answers had changed."
 
Thanks Pierre. I found nothing at their website.

--Einstein gave the same test to students every year. When asked why he would do something like that, "Because the answers had changed."
 
LittleInch said:
Got a better diagram?

Lengths?

Size?

Valves, non return valves?

Here is a diagram of the pipe downstream the pump
The lenght of the pipe is 1540m and the size of the pipe is 150mm from the pump to the valve. Then it is 350mm.
There is a non return valve in the pump's configuration.

1503-44 said:
Broken VFD?

Elevations
L2 What is that?
The tank looks disconnected from L2.
Pump data?
Flow rate?
Pipe Material

No program documentation? User Manual. Nada?

Here is a elevation diagram.
L2 is a system law associated with tank D2. This indicates that the water reaching the tank comes from above it, at atmospheric pressure.
Pump data: 50lps@23m
Flow rate: 59.34lps
Pipe material: steel
 
Elevations is giving an error.
{"data":{"error":"Imgur is temporarily over capacity. Please try again later."},"success":false,"status":403}

The pipeline terminates at atmospheric pressure above the tank and the water falls into it?

Need a pump curve for dynamic analysis.
Could that be the problem?


--Einstein gave the same test to students every year. When asked why he would do something like that, "Because the answers had changed."
 
I suspect what's happening is that on pump stop some water escapes out the top of the pipe with possibly some vacuum forming, then the water level just starts oscillating up the vertical tube / riser. The max head at the end is 52m which looks to me like the height at the top of the riser which just empties into the tank with an air gap?

1500m long you might be getting into some sort of waves forming which ripple back and forward.

this may or may not happen in reality, but is it a problem?

This is the image

Screenshot_2024-03-27_151322_mhefmb.png


Remember - More details = better answers
Also: If you get a response it's polite to respond to it.
 
Thanks for the profile.
I think something else is going on.
Too much head change for a simple oscillation.
It looks like 25m of water is disappearing, then reappearing.
And continuous, so something must be driving it.
If it was elastic storage, it wouldn't last more than 4 or 5 cycles max.
It looks like the pump is cycling on/off/on/off.
Something like what you might get if the pump curve was a flat line at zero,
except for a 23m spike at 50 lps.
When Q<>50, pump head=0
When pipe flow crosses 50 lps flow rate, it gets smacked with 23m of pump head.
I need to see that pump curve input data line.
It might just be a one point "curve".

--Einstein gave the same test to students every year. When asked why he would do something like that, "Because the answers had changed."
 
Status
Not open for further replies.
Back
Top