Eng-Tips is the largest engineering community on the Internet

Intelligent Work Forums for Engineering Professionals

  • Congratulations waross on being selected by the Tek-Tips community for having the most helpful posts in the forums last week. Way to Go!

What method is used to calculate lift coefficient in QBlade BEM simulations?

Status
Not open for further replies.

Victarion

Mechanical
Jul 10, 2019
17
0
0
NL
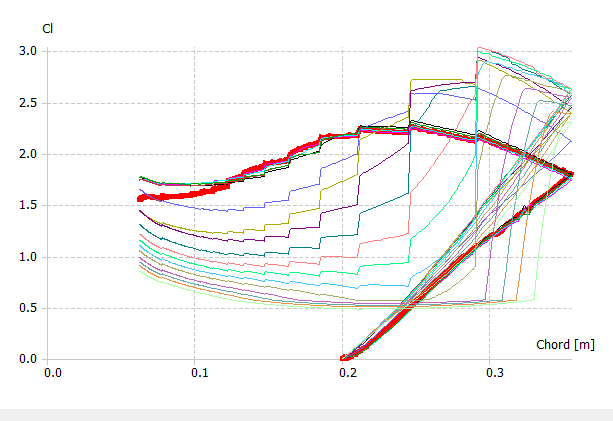
QBlade has submodules named "Rotor BEM Simulation" and "HAWT BEM Simulation". In both of these submodules, they can provide a "lift coefficient vs angle of attack" plot for every wind speed/TSR.

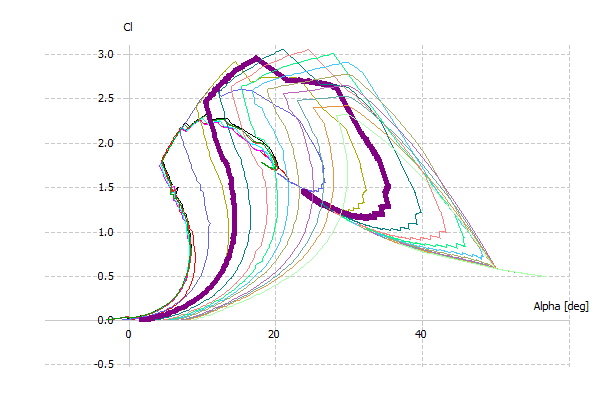
These Cl vs alpha plots are different than the one produced by XFOIL. In fact, I have never seen a Cl vs alpha plot like the one produced by the BEM simulation submodule.

I understand that lift coefficients will change when the turbine is rotating (as opposed to the stationary airfoil used in XFOIL simulations), but I still have never seen such plots.... and I do not understand how or using which method QBlade calculates them.

Does anyone know the name of the theory for which QBlade use in order to create a "lift coefficient vs angle of attack" plot like the picture below? Or at least where can I read about them? I read Robert Gasch and Jochen Twele's book on Wind Power Plants but I do not find any info about producing these plots.

Annotation_2020-09-03_005620_idcxbz.png
 
Replies continue below

Recommended for you

is that the Cl for the blade section (which would be unusual) or for the entire blade … where many different effects contribute to a complex curve ?

This curve for one wind condition and blade rotation speed ?

another day in paradise, or is paradise one day closer ?
 
@SparWeb I thought so too unfortunately :\ well all I can do is wait then

@rb1957 it is the Cl value for every incoming wind speed. I am not sure, but I think it has nothing to do with the blade.. rather the airfoil (?)

Here is two other plots just to compare with the curve above. One is Cl vs chord length, the other is Cl vs radial position from rotor hub.
Annotation_2020-09-05_180548_qbctbj.png

Annotation_2020-09-05_180610_wz5zsv.png
 
no, it can't be the Cl for every in-coming wind speed, since AoA is a function of wing and rotational velocity vectors. I can't see how it can be other than some wind speed case (defined in the input). Spanwise CL looks "sensible" … see how it changes with different twist distributions.

I can't understand Cl vs chord position ?

I wonder what your original graph (cl vs alpha) means ? as alpha changes along the span ...

another day in paradise, or is paradise one day closer ?
 
The first thing I reject is the CL>2 in all of your plots.
With a radius of 2.7 meters, the Reynold's number for a reasonable set of blades will be less than 1 million.
At low Reynold's number and with typical manufacturing tolerances there is no way to reach this.
I can get a wind turbine CP>0.5 just fine with old NACA airfoils that top out at CL=1.4. What you really need is an advantageous L/D ratio.
The actual CLmax is not important because (L/D max) is usually still on the linear part of the lift-curve slope.

It is not too difficult to make a fresh start with Wilson/Lissaman's papers and a BEM calc on paper to get started in the "realistic" zone. Admittedly, the iterative part of the work really is best done with a computer, I still suggest that the insight you gain from a few hours with the original papers will be worthwhile. Since you have Twele's book, that will do nicely, too. The algebra will show you why your graphs are in GIGO territory, and how to get out of it.


Status
Not open for further replies.
Back
Top