Eng-Tips is the largest engineering community on the Internet

Intelligent Work Forums for Engineering Professionals

  • Congratulations waross on being selected by the Tek-Tips community for having the most helpful posts in the forums last week. Way to Go!

Why/How is there a shift in a Control Valve Characteristic Curve between Inherent and Installed?

Status
Not open for further replies.

SilverRule

Chemical
May 15, 2020
53
0
0
US
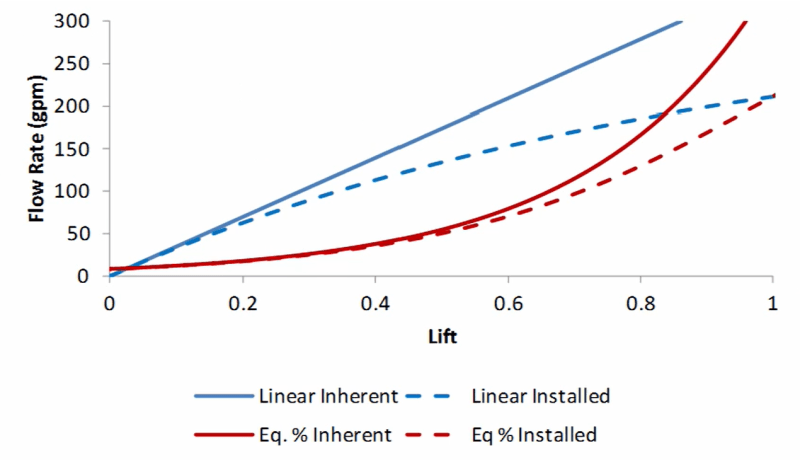
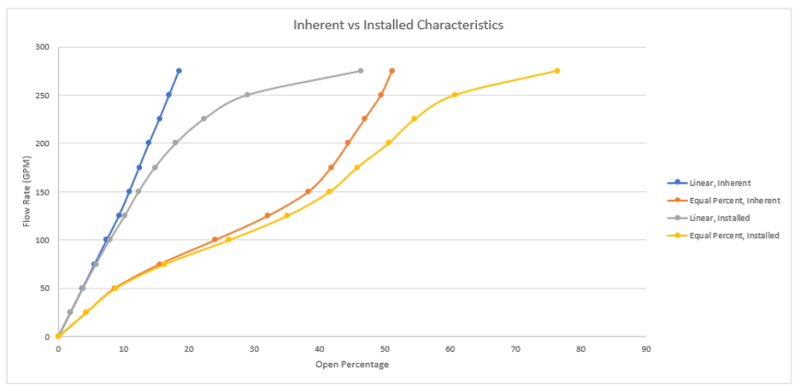
Can anyone explain how fundamentally the inherent characteristic curve of a control valve shift UP and LEFT when it's installed?

I understand that there's other pressure-generating and pressure-reducing components in the system that affect the curve. But what is the mechanism behind why it shifts UP and LEFT specifically? In other words, whether for characteristic is linear or equal percentage, why can more flow be achieved at a smaller valve opening after the control valve is installed?

I'm going through Crane TP410 and have also looked at other resources but haven't been able to find a clear explanation.

Thanks!
 
Replies continue below

Recommended for you

Easy. The inherent characteristics are measured by the vendor at constant pressure drop. In a real world system there will be upstream pressure drop and downstream back pressure due to flow through pipe and fittings. That’s what does it.

Good Luck,
Latexman
Pats' Pub's Proprietor
 
Well I guess my question is what exactly is driving the curve in that direction. I know it's from interactions with other components in the system but why/how can more flow be achieved at a smaller valve opening AFTER the control valve is installed the way these graphs are depicting? Sorry I'm relatively new to the subject.
 
Inherent_vs_Installed_Curve_kw8pd2.png


That is so strange. Almost everywhere on the internet except your first link shows it differently. See the image I'm attaching to this post which is taken from Crane TP410 which is considered to be the bible in hydraulics -- it also confirms the graph I furnished.

The engineeringtoolbox link doesn't show installed curve, it just shows the inherent curves. But it does have the following wording which is in line with the graphs I've furnished:

"Installed Control Valve Flow Characteristics
When valves are installed with pumps, piping and fittings, and other process equipment, the pressure drop across the valve will vary as the plug moves through its travel.

When the actual flow in a system is plotted against valve opening, the curve is called the Installed Flow Characteristic.

In most applications, when the valve opens, and the resistance due to fluids flow decreases the pressure drop across the valve. This moves the inherent characteristic:

A linear inherent curve will in general resemble a quick opening characteristic
An equal percentage curve will in general resemble a linear curve"
 
The curves fig 8-81 and 8-82 on page 8-77 of Perry Chem Engg Handbook 7th edn (chapter on process control) match those posted by @silver rule. Agreed, it is not clear why the curves moves up and to the left in the installed case, when less pressure drop is assigned to the control valve in the installed case. Fig 8-82 shows that the installed and inherent curves are more or less identical when assigned pressure drop (at flowing conditions) in the installed case is the same as that allocated in the inherent case, which is the only curve which makes sense.
 
georgeverghese said:
The curves fig 8-81 and 8-82 on page 8-77 of Perry Chem Engg Handbook 7th edn (chapter on process control) match those posted by @silver rule. Agreed, it is not clear why the curves moves up and to the left in the installed case, when less pressure drop is assigned to the control valve in the installed case. Fig 8-82 shows that the installed and inherent curves are more or less identical when assigned pressure drop (at flowing conditions) in the installed case is the same as that allocated in the inherent case, which is the only curve which makes sense.

Exactly. Here's a video I just found backing up what Latexman said:
Confused to say the least.
 
At the same valve opening, the "installed" valve has less pressure drop and, therefore, less flow. So, down and to the right, all day long!

Good Luck,
Latexman
Pats' Pub's Proprietor
 
I think the confusion lies in the definition of Kv, which I am not sure of. The vertical scale is the percent of Kv, not the flow rate. If Kv is the full flow of the valve, it is lower after the valve is installed. So Kv is not a constant, as implied. In this case the graphs make sense.
 
Agreed, the Flow vs Open % graph from the video SilverRule posted makes it much more clear. This is for a specific example, but to me that's the only way it makes sense due the differences between the characteristics.

I think the charts in Crane are confusing because they're % Cv vs Open % to try be more generalized, but fail at conveying the point (to me at least).

Valve_Characteristic_soiemx.png
 
I've thought about it but never set up a model to compare the inherent vs installed characteristic, but I had some time today.

This data is from a quick model I set up assuming 20 psi across the system with flow rates varying from 0 to 275 GPM. I used a Flowserve Mark One valve, unfortunately the max Cv of the linear and equal percentage trims don't completely match (193 vs 179).

The inherent model was just the control valve taking all the dP. The installed model was made with some assumed piping lengths, fittings, and a heat exchanger dP curve.

Valve_Characteristic_Test_a65oqo.png
 
ALL:

For the sake of simplicity, let's ignore the graph I posted from Crane with % of Max Kv/Cv on the y-axis. But there's still a multiplicity of sources showing/saying the same thing with flow on the y-axis:

(mentions at the bottom the an installed linear valve will work like a quick-opening valve and an installed equal percentage valve will work like a linear valve --> both are shifts toward UP and LEFT)
 
It depends upon what you're graphing when discussing inherent vs installed. If you're plotting open percentage on X axis vs Percent CV or Percent Flow (still related to Cv) on Y axis, then you'll get graphs like Crane/Engineering Toolbox Show, which all plot these units.

If you're plotting open percentage on X axis and actual flow rate on Y axis, you'll get something like the two graphs I showed.

They're showing the same things but differently. On the former graphs, the transition is up and left. On the latter graphs, it's down and right.
 
Alternatively, think about it this way:

100 GPM water, 1 psid = 100 Cv (inherent, assumes 1 psid manufacturer test)
100 GPM water, 0.75 psid = 115.5 Cv (installed, less than 1 psid)

For a given flow rate, the valve had to open more to allow the same flow because the dP across the valve was not constant.

However you want to plot it, the valve has to open more to achieve the same flow rate due to less dP. That's the important thing to remember. If you're modeling your hydraulic systems like you should, it's not really an issue.
 
RVAmeche said:
It depends upon what you're graphing when discussing inherent vs installed. If you're plotting open percentage on X axis vs Percent CV or Percent Flow (still related to Cv) on Y axis, then you'll get graphs like Crane/Engineering Toolbox Show, which all plot these units.

If you're plotting open percentage on X axis and actual flow rate on Y axis, you'll get something like the two graphs I showed.

They're showing the same things but differently. On the former graphs, the transition is up and left. On the latter graphs, it's down and right.

Hmm.. I was thinking that was the delineation but the very first link Latexman posted which is showing DOWN and RIGHT has flow% on the y-axis and not the actual flow rate:

 
RVAmeche said:
Alternatively, think about it this way:

100 GPM water, 1 psid = 100 Cv (inherent, assumes 1 psid manufacturer test)
100 GPM water, 0.75 psid = 115.5 Cv (installed, less than 1 psid)

For a given flow rate, the valve had to open more to allow the same flow because the dP across the valve was not constant.

However you want to plot it, the valve has to open more to achieve the same flow rate due to less dP. That's the important thing to remember. If you're modeling your hydraulic systems like you should, it's not really an issue.

I do understand your explanation and it makes sense. I'm still wondering though conceptually why it would be different when % of Max Cv/Kv or flow rate % are on y-axis. Shouldn't that be in line with the actual flow rate?
 
Status
Not open for further replies.
Back
Top