Eng-Tips is the largest engineering community on the Internet

Intelligent Work Forums for Engineering Professionals

Why Torque and Power curves not similar shaped? 3

Status
Not open for further replies.

richardK69

Automotive
Mar 20, 2007
1
0
0
AU
Hello,
Why doesn't the Power curve for a typical set of Power and Torque curves for an ICE (or any engine for that matter) show deviations more pronounced than it's corresponding Torque curve? P=T*omega and omega increases linearly along the x axis so therefore shouldn't any deviations on the T curve be seen on the corresponding P curve but with a greater amplitude (since they're being multiplied by omega)? The further to the right on the graph you go the greater omega becomes and hence the more pronounced the deviations should be seen on the P curve.

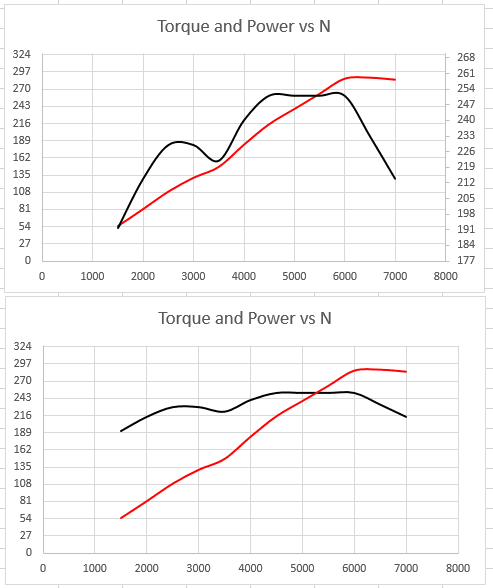
For example if you look at this set of curves the dip on the torque curve at 3500 should be even more pronounced on the P curve at the same RPM, but it isn't.

Or this set of curves: where for the torque peak at 3000 rpm the P curve hardly shows any deviation.

It's as if the omega is less than one, i.e. reducing the amplitude?

Any clarification would be most appreciated.

Rgs,
 
Replies continue below

Recommended for you

Did you bother doing any calculations to see if the graphs are correct? Starting with lb-ft of torque, hp = Tq x rpm / 5250. Run some numbers and see if the curve are actually correct.

Different scales for each curve can be one reason for the appearance of each curve.
 
Agree with Mr. Hutz. There is a dip in the P curve...it's not as pronounced because the scales are much different.

As an aside, as a Cayman S owner my butt does not notice the dip in the torque curve.
 
Pete_K said:
As an aside, as a Cayman S owner my butt does not notice the dip in the torque curve.

The 'dip' in that curve is 7 ft-lb; at 229 ft-lb, we're talking about a change of less than 3%... If you could reliably identify a 3% change in engine torque with no instruments, your services would be in high demand.

Not making fun of you- its just that I think vast numbers of people see a curve shaped like that and think 'wow that Porsche engine sucks, look at that huge torque dip'.

Well.. if the Y-axis for the torque curve was from zero to the max, instead of only covering about a third of the range, the curve looks much smoother.

richardK69 said:
P=T*omega and omega increases linearly along the x axis so therefore shouldn't any deviations on the T curve be seen on the corresponding P curve but with a greater amplitude

This is not correct- In SAE units, T = (P*N)/5252. Dividing by 5252 is important, and mathematically it means that for a torque disturbance below 5252 RPM, if plotted on the same scale, the power curve will be smoother than the torque curve, not less so.

When thinking about power and torque curves, it is also important to remember that power cannot be measured. Torque and RPM are measured- power is calculated. Power is always a function of observed torque, which means that the power curve is only as good as the torque data.

This image is both of the curves from your link- plotted on the same (separate) scales as in the link, and then plotted together with the same y-axis. Plotting them together smooths the torque curve significantly.

Capture_k3wshs.png
 
Looks like a pretty respectable torque curve to me. udos to the Porsche designers and performance engineers.
A very nice characteristic from 1500-3500rpm, where I assume most driving is done, and also a very nice characteristic from 3500 to 7000, when one desires to use the engine's full potential.
I wouldn't be surprised to learn that the transmission shift schedule is programmed to behave accordingly.

"Schiefgehen wird, was schiefgehen kann" - das Murphygesetz
 
richardK69 said:
It's as if the omega is less than one, i.e. reducing the amplitude?
Taking Lionel's comment one step further, that's exactly what is happening, except that you're looking for a multiplier rather than omega directly. Your 'multiplier' is [omega]/5252.


Norm
 
If you want to use the multiplier omega, then omega for lb-ft of torque would be 0 @ 0rpm and linearly increases to 1 @ 5250rpm. It continues to linearly increase above 5250rpm, and is >1 as well.
 
Status
Not open for further replies.
Back
Top