owais ahmed
Student
- Nov 10, 2021
- 10
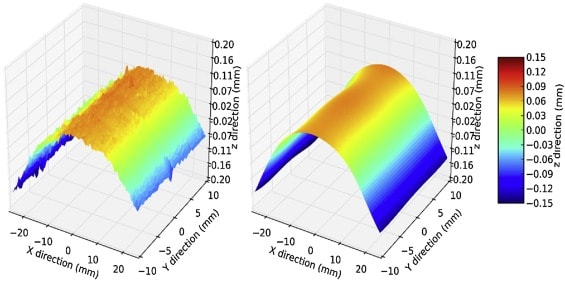
I would like to plot 3 dimensional graph in abaqus in which z axis represent the stress and x represent the distance of selected elementss in x direction and y represent the selected elements distance in elements inward direction (both x and y axes represent s the distance of selected elements in x and y direction ) and z axis represent the stresses.....As just shown in the picture....How could i extract the data of mises along with x y and z coordinates plot it on python matplotlib.just the curve as shown in the picture.