Continue to Site

Eng-Tips is the largest engineering community on the Internet

Intelligent Work Forums for Engineering Professionals

  • Congratulations SSS148 on being selected by the Eng-Tips community for having the most helpful posts in the forums last week. Way to Go!

Alex Krulikowski workbook -"max dimension 2.15" shown on the minimum X distance 2

Status
Not open for further replies.

aniiben

Mechanical
May 9, 2017
158
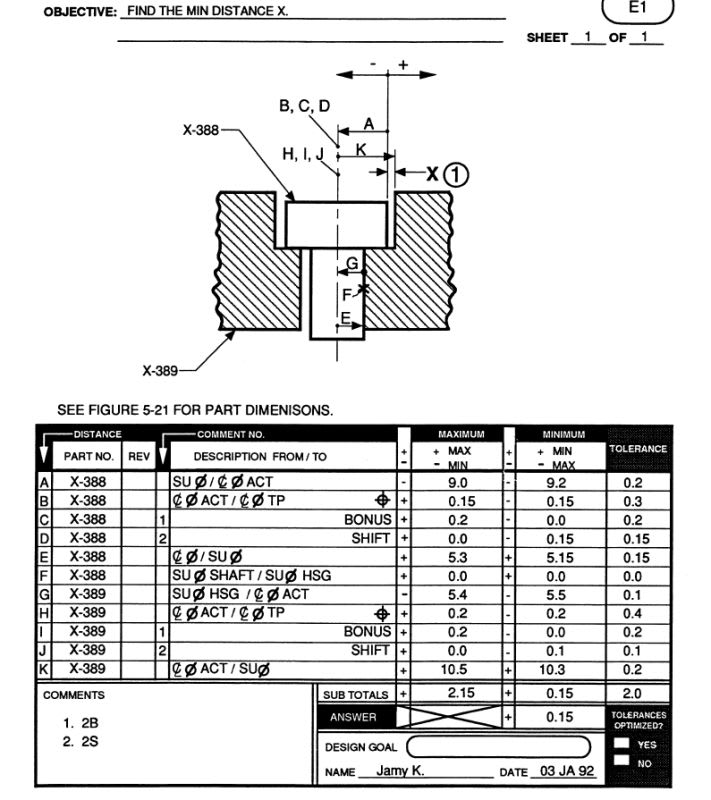
If the objective is to calculate the minimum distance then why 2.15 maximum is value SHOWN has to do with the correct answer.

As far as I understood the correct answer for minimum distance is: 0.15.

The maximum X distance is 2.85. Then what 2.15 is good for? What is the meaning of 2.15 value?


AK_Stackup_-_Copy_axrp9d.jpg


AK_exercise_-_Copy_xfanxx.png
 
Replies continue below

Recommended for you

Are the variation analysis packages capable to switch between these formulas/calculations (RSS, Modified RSS, Gilson, etc. )? I suspect there are, but I have no exposure to any.

 
VSA uses whatever statistical distribution one might expect for any particular dimension, though I think it defaults to a Uniform distribution. It then runs as many simulations of randomly chosen variations as one likes. It does not do "worst case" because in actual production of parts an assemblies, there is no "worst case." It's output is a statistical distribution from which one can extract a fit with known distributions, such as Gaussian (aka Normal) etc, to make production predictions.

I felt that it was best suited to closely coordinated factory/QA/QC efforts where the production distributions would be used in the analysis to make decent predictions of shipped product characteristics. It still worked as an initial predictive tool, but that's largely a waste when it comes to optimizing the cost of a design.
 
3DDave said:
It still worked as an initial predictive tool, but that's largely a waste when it comes to optimizing the cost of a design.

That is one of the arguments management used when asked why no variation analysis packages is available/purchased. Cost per seat and cost of training with no real benefits (as per their opinion).
Still I would like to be involved / know these software(s) for my own sake/ carrier development. Is any different than a “regular” CAD?
 
greenimi - the target for VSA was the Detroit automotive industry, where they did capture production variation and could use it. Build a few million cars and any small savings is worth the effort. On the small end, of ones and twos or even hundreds? I can see that as a tough sell. So it ends up being expensive to develop with a bunch of effort to apply it, and then a small market, so the costs are high and the market that can justify it is tiny.

I lucked into it because it was stupid DoD money being spent in a whack-a-mole effort because the product we were producing was desperately needed and our "world class" manufacturing group was more like 3rd world piece work, which meant that parts didn't fit and no amount of actual analysis would stop them using grinders at final assembly.

The VSA interface wasn't much different from any CAD application as it was integrated with Pro/E. The tedious part was identifying which surfaces were controlled by each dimension. The developers claimed there would not even be that much to do if PTC had improved the API, but PTC had gotten into bed with Ti-Tol/Ce-Tol, so that was that.

For me the greatest benefit was seeing an evaluation based on the mathematics and not including excuses that suppliers would not exceed some tolerance because that's just something they would not do.

OTOH, I saw drawing packages for TACOM and other DoD agencies that had no angle tolerances on directly toleranced parts, not an FCF in sight, and no one seemed to notice. Default perpendicularity of whatever manufacturers produced was sufficient for the purpose without ever explicitly specifying it.

It's not that hard to write explicit programs for limited cases; I did that for evaluating the boundary of a feature in that one figure. It's a bit tedious at first to get a library of functions together to do things like take a couple of mating points and accumulate the translations and rotations between the parts in a stack.

If one is interested in learning about it, writing your own is the best technique.
 
greenimi,

First of all, my apologies for late reply but I am working on a few things this week, thus the delay. 

I will start by saying that my experience with a variation analysis software is limited to VIS VSA, (which I have been actually using quite extensively in a recent period of time), however I had a chance to see some materials that compared VIS VSA with other software, like 3DCS, and my observation was that even for really simple cases results might not be the same. I didn't really analyze the root cause of it, though.

I would say that from tolerance analysis perspective the assembly we have been discussing here is indeed relatively simple case, but only at first glance, and therefore I wouldn't really expect the numbers obtained by a software (let's focus on VIS VSA) to match with the spreadsheet numbers. There are a few reasons of that (some of which I should have probably mentioned in my previous reply):

1. VIS VSA uses Monte Carlo statistical sampling method and is able to produce the same results as RSS spreadsheet only if all the contributors affecting calculated gap meet assumptions of RSS method. 

2. One of core assumptions of RSS method is that all contributors in the stack are independent of each other. As can be easily imagined, this is not true in the discussed scenario, where bonuses depend on the actual sizes of the toleranced features, and the datum shifts depend on the actual sizes of the datum features. The conclusion can be that technically the spreadsheet RSS numbers are simply incorrect in this and other similar cases. So in real life, the methodology is very often modified, as mentioned by J-P, in different ways. One example can be a "Weighted RSS" approach, where the RSS total tolerance is multiplied by a factor (for instance 1.5) to account for lack of  independence of the contributors or, for example, for the fact that not all contributors in the stack are normally distributed.

3. By default, VIS VSA performs 3D analysis. The excel analysis is solely 1D, so it does not take into account all the rotational effects that might happen in a real assembly. Therefore, the default VIS VSA results cannot and should not be the same. These rotational effects come from different sources. One is possible looseness between components in the assembly allowing for rotation. Second is the fact that by default geometric tolerances (like position) are split in VIS VSA into location and orientation components - in other words, the fact that there is a tolerance of position of  0.3 doesn't automatically have to mean that whole 0.3 contributes to the translation of a feature only. Some portion of it is used as an orientation contributor.   

It is possible (to some extent) to simplify the 3D analysis and make it 1D-like (by turning off some of rotational effect), but that's the process used usually to validate if the entire analysis has been prepared correctly, and not something that would normally be done when trying to get 3D results.
 
Could someone post a link to the spreadsheet for this tolerance worksheet? Looks quite handy!

I'm not a vegetarian because I dislike meat... I'm a vegetarian because I HATE PLANTS!!
 
Hallec said:
Could someone post a link to the spreadsheet for this tolerance worksheet? Looks quite handy!

Not sure I understand. Could you, please, elaborate?


Hi greenimi - OP and pmarc both posted different examples of a chart for processing tolerance stack-up. If someone has this in excel with the applicable equations, I would love to have a copy for myself.

I'm not a vegetarian because I dislike meat... I'm a vegetarian because I HATE PLANTS!!
 
Status
Not open for further replies.

Part and Inventory Search

Sponsor