steveh49 said:
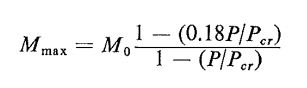
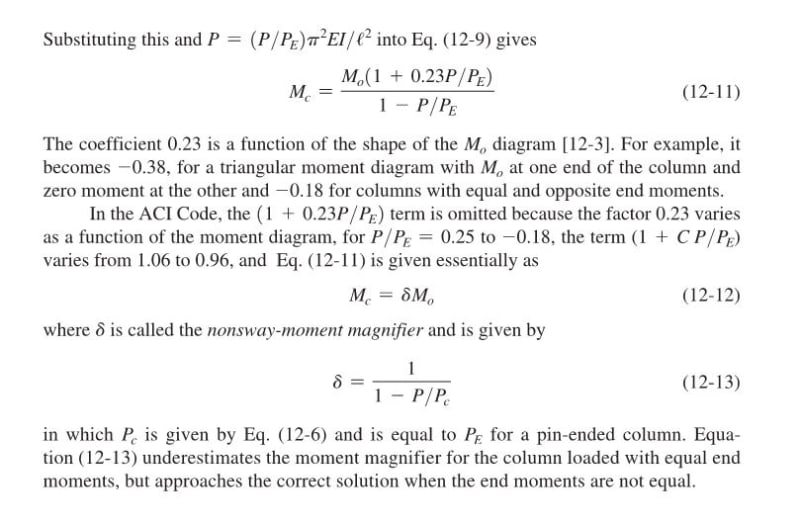
For the U factor, I haven't derived it myself but McGregor/Wight say there should be a (1+0.23(Cf/Cr)) factor in the numerator for uniform moment. Leaving it out would be unconservative for any value of compressive force.
Yeah, I figured that uniform moment would turn out to be the culprit. Fortunately, that condition is pretty rare, particularly in steel where you usually encounter less beam/column continuity than you do in concrete. I've included the Wight stuff below for the benefit of any interested parties. It appears pretty spot on for a lot of practical conditions obviously. Not especially conservative, mind you, just pretty accurate.
steveh49 said:
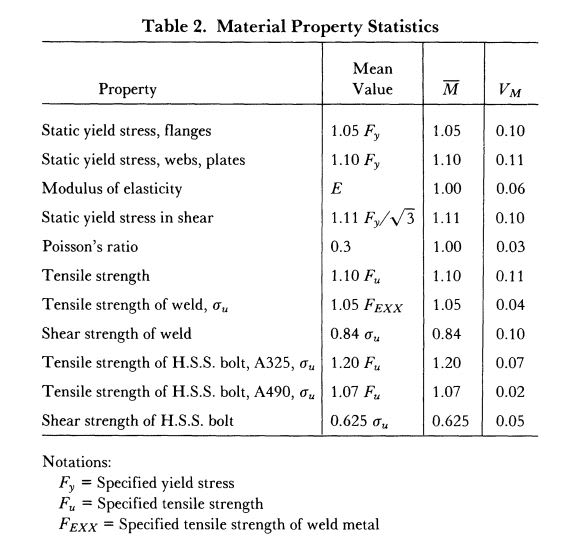
If average is 1.05*Fy and the coefficient of variation is 10%, around 33% of samples fail in a normal distribution (?), and a not-negligible proportion would fail by more than the capacity reduction factor. Is that your expectation?
I haven't thought too hard about it but, yeah, something like that. My argument is not that material strengths don't come in reliably high. They
do. Rather, my argument is that I don't consider it to be within a particular designer's purview to make use of that fact, disregarding what our standards have to say about it. My impression of how the things work in the steel production world is something like this:
1) The design community establishes material requirements and safety factors based on research etc.
2) The steel production industry reacts to [1] by adjusting their metallurgy so that they are comfortable with the risks involved in their product possibly coming in lower than spec. This surely often means that a supplier's internal specifications exceed those requested of the design community. There may also be other reasons to adjust metallurgy in a manner that would produce over-spec Fy's that have nothing to do with trying to meet Fy.
3) If designers raise their expectations of Fy based on mill certificates etc, producers will probably just return to #2 and create an even more demanding internal spec. In this respect, it kind of becomes a tail chasing exercise.
steveh49 said:
are North American steel makers having to deal with this extremely difficult circumstance?
I, for one, don't know and don't much care. Like I said, I simply do not consider it my purview to mess with the established, code reliability models in routine design.
steveh49 said:
Do design engineers approve steel that's 10% under strength?
This designer does as long as it's not a systemic problem where everything is coming low all of the time. In my opinion, this is one of the things that material safety factors are for.
steveh49 said:
#3 is accounted for by the perturbation and second-order analysis/moment magnification, combined with the column curve on the capacity side (hidden additional moment). Additional moment in excess of the ULS value requires loading in excess of the ULS load. No argument that things might go pear-shaped at that point.
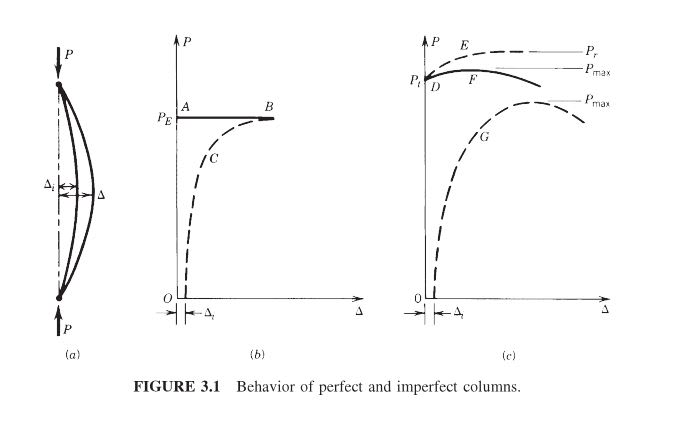
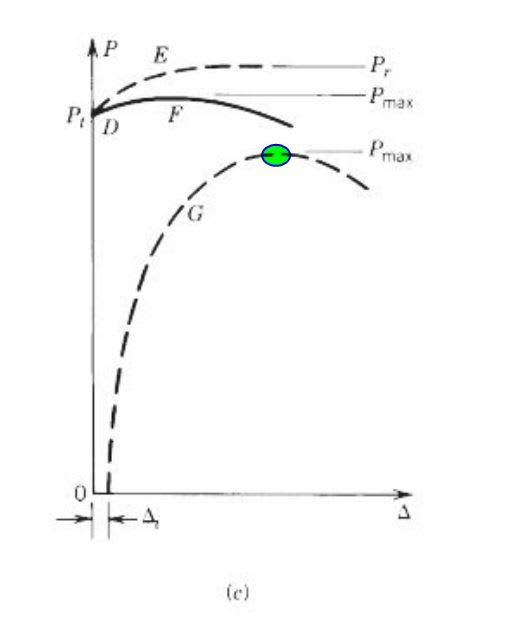
I still disagree. As you know, North American column curves are based on SSRC curves and the concept of maximum strength as applied to imperfect columns and represented conceptually by path [G] in the diagram below frame the
Guide to Stability Design Criteria for Metal Structures. That maximum strength represents a condition of neutral equilibrium between external and internal moments, just as it does in good old Euler buckling. Whether you want to call Pmax or a point on the curve 1% to the right of Pmax the "failure load" is immaterial for practical design purposes: Pmax represent the upper limit of usable column stability.