Pretty Girl
Structural
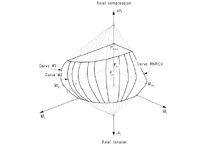
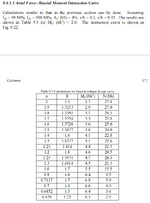
This is from "Reinforced concrete design to eurocodes" by prab bhat, page 371 and 372.
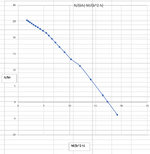
It has mentioned the it's for My/ (hb^2) = 2.
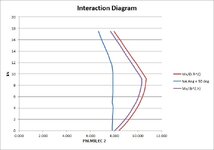
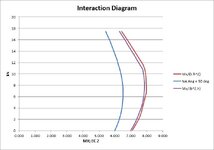
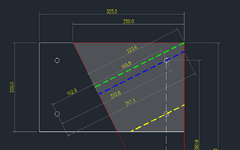
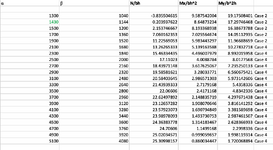
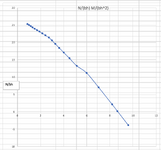
But I don't know how to reproduce with that ratio kept constant. So, I tried to create it with making the alpha and beta values at a constant ratio of 0.8 (beta = 0.8 alpha). Then I produced a chart.
Since I didn't reproduce the exact chart in the book, now I have another problem. I have got no reference chart to compare my chart with. Can anyone kindly help me find out if my chart is correct for the column dimensions and data I provided.
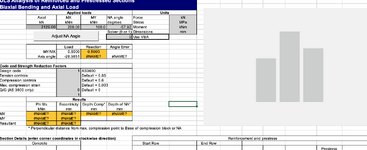
Are there any free software/ excel sheet to enter the column details mentioned below and compare it with my chart?
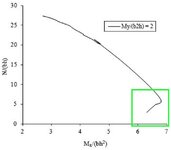
I'm concerned that my chart may not be correct as I don't see the part the book's chart have I have shown in the green rectangle below, when I produce my chart. I understand it cannot be the same chart, but if my chart is correct that "nose" like curve should also be in my chart isn't it.
1. Chart from the book
2. The chart I produced
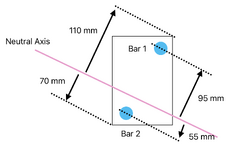
This is a rectangular column, h = 2000 mm, b = 1000 mm. I maintained "beta/ alpha ratio = 0.8".
4 reinforcement bars, 1 bar each corner. Steel percentage 4% (So, 1% bh area for each bar).
40 mm distance from column surface to the centroid of r/f for each bar.
fck = 30 MPa, fcd = 20 MPa, fyk = 500 MPa, fyd = 434.7 MPa.
It has mentioned the it's for My/ (hb^2) = 2.
But I don't know how to reproduce with that ratio kept constant. So, I tried to create it with making the alpha and beta values at a constant ratio of 0.8 (beta = 0.8 alpha). Then I produced a chart.
Since I didn't reproduce the exact chart in the book, now I have another problem. I have got no reference chart to compare my chart with. Can anyone kindly help me find out if my chart is correct for the column dimensions and data I provided.
Are there any free software/ excel sheet to enter the column details mentioned below and compare it with my chart?
I'm concerned that my chart may not be correct as I don't see the part the book's chart have I have shown in the green rectangle below, when I produce my chart. I understand it cannot be the same chart, but if my chart is correct that "nose" like curve should also be in my chart isn't it.
1. Chart from the book


2. The chart I produced
This is a rectangular column, h = 2000 mm, b = 1000 mm. I maintained "beta/ alpha ratio = 0.8".
4 reinforcement bars, 1 bar each corner. Steel percentage 4% (So, 1% bh area for each bar).
40 mm distance from column surface to the centroid of r/f for each bar.
fck = 30 MPa, fcd = 20 MPa, fyk = 500 MPa, fyd = 434.7 MPa.


Last edited:


