Continue to Site

Eng-Tips is the largest engineering community on the Internet

Intelligent Work Forums for Engineering Professionals

  • Congratulations GregLocock on being selected by the Eng-Tips community for having the most helpful posts in the forums last week. Way to Go!

Bi-axial bending chart - concrete column

Pretty Girl

Structural
Nov 22, 2022
84
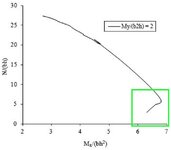
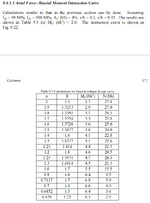
This is from "Reinforced concrete design to eurocodes" by prab bhat, page 371 and 372.
It has mentioned the it's for My/ (hb^2) = 2.

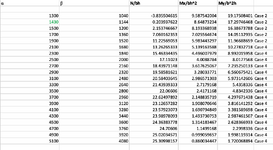
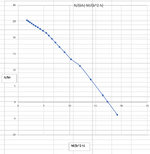
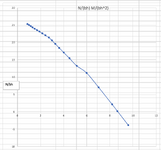
But I don't know how to reproduce with that ratio kept constant. So, I tried to create it with making the alpha and beta values at a constant ratio of 0.8 (beta = 0.8 alpha). Then I produced a chart.

Since I didn't reproduce the exact chart in the book, now I have another problem. I have got no reference chart to compare my chart with. Can anyone kindly help me find out if my chart is correct for the column dimensions and data I provided.

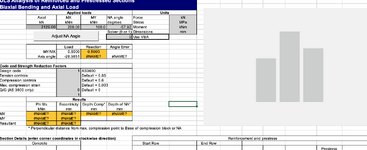
Are there any free software/ excel sheet to enter the column details mentioned below and compare it with my chart?

I'm concerned that my chart may not be correct as I don't see the part the book's chart have I have shown in the green rectangle below, when I produce my chart. I understand it cannot be the same chart, but if my chart is correct that "nose" like curve should also be in my chart isn't it.

1. Chart from the book
1734934729980.png
Untitled 5.jpg


2. The chart I produced

This is a rectangular column, h = 2000 mm, b = 1000 mm. I maintained "beta/ alpha ratio = 0.8".
4 reinforcement bars, 1 bar each corner. Steel percentage 4% (So, 1% bh area for each bar).
40 mm distance from column surface to the centroid of r/f for each bar.
fck = 30 MPa, fcd = 20 MPa, fyk = 500 MPa, fyd = 434.7 MPa.
Screenshot 2024-12-23 at 5.14.55 pm.png

Screenshot 2024-12-23 at 5.14.33 pm.png
Screenshot 2024-12-23 at 5.14.21 pm.png
 
Last edited:
Replies continue below

Recommended for you

I don't have time for a detailed answer now, so I'll just say:

1) If your results don't follow the form of the chart from the book, there is definitely something wrong.
2) My blog has several spreadsheets for biaxial bending, including VBA versions. You can search for biaxial bending, or just scroll through the downloads list.

let me know if you have trouble finding anything.

Your biaxial excel file does not work. I'm in macOs. Excel Version 16.92

Screenshot 2024-12-23 at 10.13.45 pm.pngScreenshot 2024-12-23 at 10.13.57 pm.pngScreenshot 2024-12-23 at 10.14.19 pm.png
 
Not much I can do about the spreadsheet not working on Apple Excel I'm afraid. If you can find specific code lines it doesn't like I may be able to do something, but even then I don't have access to Apple computers, and I'm not familiar with their version of VBA.

I had a quick look at results from my spreadsheet for the given cross section and noticed that:
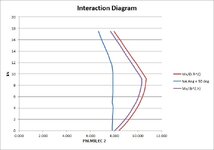
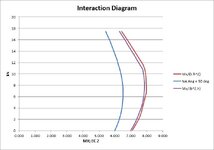
1. The reinforcement arrangement makes a big difference, see graphs below.
2. With 1 bar in each corner my results with a NA at 50 degrees to horizontal was close to uniform capacity up to about 20,000 kN axial load.
3. Even so, your results look wrong. The moment capacity should not continue to increase with tensile axial load. I suggest doing a hand check on 1 or 2 load cases.
4. I am getting higher moment capacity than in the graph from the book. Is he applying UK reduction factors?
5. Can you supply more details of the example case. Any additional reduction factors? What are x/b and y/h? What are the alpha and beta factors you mention?

My results for Mx/(b.h^2) with NA parallel to X, My/(b^2.h) with NA parallel to Y, and Mr/(b.h^2) for NA at 50 degrees to X
1 bar in each corner:
biax5-1.jpg

Bars distributed along each face:

biax5-2.jpg
 
@Pretty Girl I’ve seen some of your other posts and it seems you are jumping around trying out different methods described in textbooks which approximate biaxial bending. From another post your mentioned you don’t want an approximate answer.

In my opinion I think going back to first principles and trying to solve the biaxial bending might be better as these textbooks methods you’ve presented make some gross simplifications that might be making things confusing.

I would suggest just pick a section shape and reinforcement arrangement assume a neutral axis angle and depth and then manually work through computing P, Mx, and My. Everything after being able to that is an exercise in numerical methods of finding a neutral axis depth and angle that match a set of applied loads or other criteria such as the resulting Mx/My vector being a constant.

If you want to continue with the textbook methods than I would suggest fully replicating the textbook examples prior to trying to expand to another problem.
 
@IDS @HTURKAK @Celt83 @Lomarandil @ggcdn @Agent666
Dear Pretty GIRL ;

- Honestly i did not check your calculation in detail but apparently you have a confusion for the preparation of interaction curve. The subject interaction curve at Table 9.3 ( Prab BHATT's book ) valid only for My/ (hb2) = 2.0 You are expected to fix a certain value for My/ (hb2) and get two variables ( Mx/(bh2) and N/(bh) . and put random values for these varaibles to get an interaction curve for the fixed value of My/(hb2),
- In order to generate interaction surface , use interaction curves for My/ (hb2) different values ,
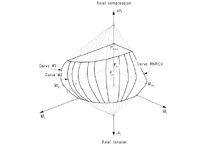
- The following snippet from SAP2000 RC Design Manual tutorial , Notice that , My has zero value for curve 1 and Mx has zero value at curve #NRCV
1735062163561.png

- The dimensions which you have choosen are not realistic. ( h = 2000 mm, b = 1000 mm., 40 mm distance from column surface to the centroid of r/f for each bar.Steel percentage 4% (So, 1% bh area for each bar, 2000*1000*0.01=20000 mm2 and so dia of bar makes 160mm and 40 mm distance from column surface to the centroid of r/f for each bar??)
- I will try to look your calculation in detail .
 
Last edited:
@HTURKAK @Celt83 @IDS

Kindly go through the steel calculation and let me know if it's wrong. For the concrete part I used a different software to get area of the pentagonal shapes etc, and it's long, so didn't include it here. I will try fixing the steel calculation first and will proceed.

Feel free to make changes in this online spreadsheet (steel calculation)


Further, Happy new year!
 
Last edited:
I had a look at the spreadsheet. Not everything is clear to me, in particular I don't know what the dis dimension is, and I don't know why you have two different dimensions from the max compression fibre to the NA. There is only one NA.

I get exactly the same compression strains as you, but for the bars in tension I get much lower strains (-0.00077 and -0.00161).

For the full calculation remember to reduce the force in the compression bars by the concrete compression stress x bar area.

And happy New Year to you too :)

Thank you so much for going through the calculation.
In my calculation, I noticed when the axial force is highest the moment is also gets to highest. That's not possible. So, there's something wrong with what I take as moment. May be the positive and negative moments should not be summed together? Can you please check why the moment also gets bigger in that calculation?
 
Can you please check why the moment also gets bigger in that calculation?
OK, but we need to work out what is happening with the tensile strains first!
 
OK, but we need to work out what is happening with the tensile strains first!

But how to? Do you have any manual calculations that you can share for even a simple two bar scenario to understand if I'm doing it incorrectly?

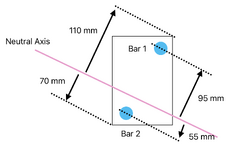
Screenshot 2025-01-02 at 5.15.22 pm.png

For that, the bar area = 100 mm2 (for each bar), concrete strain = 0.0035, steel strain = 0.00217392, steel design strength = 434.783, E = 200000

compression considered positive and tension negative (In this scenario, bar 1 is in compression side)

So,
Strain for bar 1 = (0.0035/110 mm) * 95 mm = 0.00302273 < 0.00217392 --> 0.00217392 selected
Strain for bar 2 = (-0.0035/70 mm) * 55 mm = -0.00275 < -0.00217392 --> -0.00217392 selected

Stress bar 1 = 0.00217392 * 200000 = 434.784 < 434.783 --> 434.783 selected
Stress bar 2 = -0.00217392 * 200000 = -434.784 < -434.783 --> -434.783 selected

Force bar 1 = 434.783 * 100 mm^2 = 43478 N = 43.4 kN
Force bar 2 = -434.783 * 100 mm^2 = -43478 N = -43.4 kN

Axial force = (41.3 kN) + (-41.3 kN) = 0 kN

Moment bar 1 = 43478 * 95 mm = 4130410 Nmm = 4.13 kNm
Moment bar 2 = -43478 * 55 mm = -2391290 Nmm = -2.39 kNm

Moment = 4.13 kNm - 2.39 kNm = 1.74 kNm

Is this correct or is it wrong? I used the same method in the google spread sheet I provided. I just used simple geometry to find the distances.
 
Last edited:
It is wrong. The strain at the corner with maximum tensile strain is not -.0035 unless the NA is exactly mid-way between the two corners.

Use the maximum compressive strain as the starting point for both bars, then the strains are:

1) 0.0035 * (1 - (110-95)/110) = 0.00302273
2) 0.0035 * (1 - (110+55)/110) = -0.00175

Or if you prefer for 2): 0.0035 * -55/110 = -0.00175

Probably a good idea to draw some sections showing the strain distribution, which would make it obvious that the maximum tensile strain was not -0.0035 in this case.

Please check with this spread sheet link (updated the previous one). But still when axial force increases the moment increases as well. (you can change the alpha beta to change neutral axis or column dimensions in the following spreadsheet and see). Is it still wrong?

 
Last edited:
I now agree with your calculated bar forces.

For the bending moments you should be taking moments about the X and Y axes passing through the centroid of the uncracked section (i.e. the mid-point of the rectangle).
Do the same for the concrete and you can then find the resultant moment magnitude and direction.

Thank you for confirming.

So the steel moment calculation is not correct, is it.

However, I don't want to know the X and Y axes moments yet. I just want to correct the total moment (Mt) in that calculation. It should act in the same way without dividing yet, won't it? (I mean still the total moment should reduce when total axial force increases and vise-versa, shouldn't it?) I don't see that in my calculation, that's why I'm asking how to rectify it.

Once the calculation is right and at the very end of the calculation (even after calculating the concrete moments etc), I'll use something like mx = mt cos theta, my = mt sin theta to divide it to axes. But before that I just need to know the total moment (Mt).

Isn't there any way that we can get steel moments while keeping the tilted angle of the NA? (without calculating the axes separately) I'm doing this because I don't want to make things complicated by dividing it into x and y axes yet. I need to know the very basic principle of calculation. I want to avoid any simplified methods.
 
The problem is, the reinforcement and the concrete stress block are in general not symmetrical about the perpendicular to the NA, so in general the direction of the resultant moment about the NA is not perpendicular to the NA.

The simplest way to handle that is to take moments about the horizontal and vertical axes through the section centroid and combine those to find the magnitude and direction of the resultant. You can work with axes parallel and perpendicular to the NA if you want to, but it just makes the calculation more complicated, you still have to calculate moments about two perpendicular axes, and you end up with the same result.
 
Thank you for confirming.

So the steel moment calculation is not correct, is it.

However, I don't want to know the X and Y axes moments yet. I just want to correct the total moment (Mt) in that calculation. It should act in the same way without dividing yet, won't it? (I mean still the total moment should reduce when total axial force increases and vise-versa, shouldn't it?) I don't see that in my calculation, that's why I'm asking how to rectify it.

Once the calculation is right and at the very end of the calculation (even after calculating the concrete moments etc), I'll use something like mx = mt cos theta, my = mt sin theta to divide it to axes. But before that I just need to know the total moment (Mt).

Isn't there any way that we can get steel moments while keeping the tilted angle of the NA? (without calculating the axes separately) I'm doing this because I don't want to make things complicated by dividing it into x and y axes yet. I need to know the very basic principle of calculation. I want to avoid any simplified methods.
I gone through the last excel sheet but I do not go through the reference book by prab bhat yet because I don't have that book

For me, the calculation work out including the moment capacity by reinforcement and theoretically is correct based on your assumption of NA where it will be exactly as your assumed line. Because of this, the calculated capacity is only valid if and only if the resultant moment is rotate along your assumed NA angle. However, in reality, it is rarely behave as such.

I agree with IDS where the simplest way to handle is to take moment about X and Y axis, that's why Eurocode EC2 (2004) also provide the recommendation at 5.8.9(2) and 5.8.9(4). This is because the way you are doing here is only valid for a fixed ratio of Mx and My, where in reality, is hardly to achieve.
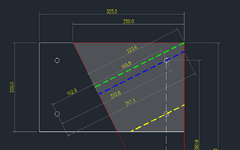
Your concrete stress block diagram also not symmetrical, thus, when you calculating concrete capacity supply by concrete, you will need to calculate an equivalent depth.
In a simpler word, you can see the green, blue and yellow having different effective depth and will impact your capacity by concrete.
Although, I was thinking Acc x fcd x Area x Distance to centroid may solve this, but I never calculate that yet before.
1735870664599.png

Regard of what you mentioned "without calculating the axes separately" typically, we will have moment in X and Y axes instead of a resultant moment, but if this is the case, the calculation based on reinforcement only seem correct to me because Force x Level arm is the principle.
 
The problem is, the reinforcement and the concrete stress block are in general not symmetrical about the perpendicular to the NA, so in general the direction of the resultant moment about the NA is not perpendicular to the NA.

The simplest way to handle that is to take moments about the horizontal and vertical axes through the section centroid and combine those to find the magnitude and direction of the resultant. You can work with axes parallel and perpendicular to the NA if you want to, but it just makes the calculation more complicated, you still have to calculate moments about two perpendicular axes, and you end up with the same result.

Kindly go through the updated spread sheet and let me know what needs to be amended.

 
I gone through the last excel sheet but I do not go through the reference book by prab bhat yet because I don't have that book

For me, the calculation work out including the moment capacity by reinforcement and theoretically is correct based on your assumption of NA where it will be exactly as your assumed line. Because of this, the calculated capacity is only valid if and only if the resultant moment is rotate along your assumed NA angle. However, in reality, it is rarely behave as such.

I agree with IDS where the simplest way to handle is to take moment about X and Y axis, that's why Eurocode EC2 (2004) also provide the recommendation at 5.8.9(2) and 5.8.9(4). This is because the way you are doing here is only valid for a fixed ratio of Mx and My, where in reality, is hardly to achieve.
Your concrete stress block diagram also not symmetrical, thus, when you calculating concrete capacity supply by concrete, you will need to calculate an equivalent depth.
In a simpler word, you can see the green, blue and yellow having different effective depth and will impact your capacity by concrete.
Although, I was thinking Acc x fcd x Area x Distance to centroid may solve this, but I never calculate that yet before.
View attachment 2972

Regard of what you mentioned "without calculating the axes separately" typically, we will have moment in X and Y axes instead of a resultant moment, but if this is the case, the calculation based on reinforcement only seem correct to me because Force x Level arm is the principle.

Thank you for your response.
I'm wondering if we simplify the concrete stress block, like if we consider the stress block to be 0.8x than skewed parabolic block. Cant we get it in natural form without dividing it into axes. (For the steel moment calculation)? I don't even know if its needed for steel calculations.

In a simpler word, you can see the green, blue and yellow having different effective depth and will impact your capacity by concrete.
Although, I was thinking Acc x fcd x Area x Distance to centroid may solve this, but I never calculate that yet before.

Are you mentioning about the concrete moment? I used the centroid of the Acc (not shown in the spreadsheet though as it's just steel calculation). But I guess we can divide it into couple of more stripes (or thousands) of strips and take centroids of each strip and then sum up all the tiny moments to get more accurate moment Mcc?.
 

Part and Inventory Search

Sponsor