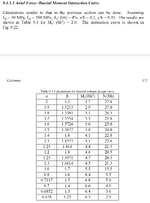
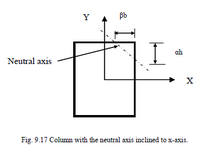
These are randomly selected to start with ,but you should select different α and β to locate NA so to cover the total cross-section and draw the chart with reasonable accuracy.
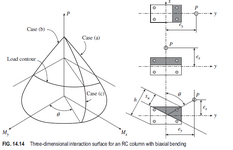
The Fig. 9.22 Column design chart for axial force and biaxial bending is valid for My/b2h=2.0 only. Total biaxial bending graph is 3D like bulb.
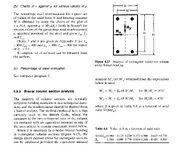
The following excerpt from NARAYANAN , Design of RC Structures.
View attachment 2420
Notice that Case (a) , My =0 and Case (b) Mx= 0 , these are unique and uniaxial bending while Case (c) biaxial and there can be a lot of different cases.
@HTURKAK
Thank you for the response.
So, that means the method in the book cannot be used for real life design of columns. That method is not accurate?
Why can't we separately produce two charts for each axis than using a "bulb" like graph?
I mean, we already know how much maximum strain a specific steel bar goes through, and the contribution ratio for each axis (eg: -0.230, -0.315, for the bar 1) (the method in that book).

Then why can't we just use one of the contribution ratios (let's say we chose -0.230 for x axis), then calculate the new maximum strain for that specific bar for x axis, and produce a chart by considering it as a uni-axial column. And then do the same for other contribution ratio -0.315 and produce a chart with it. Then we will have two seperate charts for each axis, but fully compatible for bi-axial design of column. Is that incorrect or unsafe method for real life situations?
eg:
contribution for X axis -0.230
contribution for Y axis -0.315
summation of those = -0.545
and for that yield strain of steel for that steel bar (ε) = 1.587 x 10^-3 (the answer in that book for the bar 1)
the x axis contribution's percentage if we calculate it,(-0.230 / -0.546)*100 = 0.422%,
then why can't we just calculate following from that
(1.587 x 10^-3) * 0.422 =0.00067 as the new strain for x axis and design it as uniaxial chart? (and then we shall repeat the same calculation for other axis to produce a seperate chart for that axis)
Any suggestions to produce an accurate bi-axial charts (two seperate charts is fine if it's accurate) than using a bulb?, which is not practical if not using software.
I feel like entire calculation of biaxial bending of this prab bhat's book is an approximate method not an accurate method, as even the contributions feels like not correct in that book and feels like it assumed that the neutral axis always occur perpendicular to an axis. Which is not correct, is it?
What if we already know the Mx/My ratio? then the book's method is accurate for real-world calculations?
Because we always have that Mx and My before designing the column anyways. Let's say Mx = 200 kNm and My = 50 kNm, so the ratio is 200/50 = 4:1. So we can simply use that ratio for beta and alpha?
eg:
beta | alpha
4 | 1
8 | 2
16 | 4
and then produce the chart to have an accurate chart for that specific Mx = 200 kNm and My = 50 kNm case?
I don't actually want to produce a universal chart. I just need to have a chart to design a column if we know the N, Mx and My. As my applications are real-world.


