Eng-Tips is the largest engineering community on the Internet

Intelligent Work Forums for Engineering Professionals

Climate Sensitivity and What Lewis and Curry 2014 Has to Say About It 12

Status
Not open for further replies.

rconnor

Mechanical
Sep 4, 2009
556
0
0
CA
Ah yes, it’s that time again folks. A paper is released, in this case Lewis and Curry 2014, that says climate sensitivity is on the low end of the spectrum and the “skeptic” community starts banging pots and pans claiming the ACC theory is dead. Well, like most things in the field of climate science, it's not nearly that simple. Let's look at the entire story.

Equilibrium Climate Sensitivity (ECS) and Transient Climate Response (TCR)
Equilibrium Climate Sensitivity (ECS) – the amount the planet will warm in response to a doubling of atmospheric CO2 concentration (the base is usually taken from preindustrial levels of 280 ppm). ECS includes both fast and slow feedbacks, so ECS is not fully realized for decades or centuries after CO2 is held constant.

Transient Climate Response (TCR) – similar to ECS but only includes fast responding feedbacks. In other words, TCR is the temperature rise at the time atmospheric concentrations hit 2x the baseline, not where it will settle out to. As slow responding feedbacks tend to be positive, TCR is smaller than ECS.

These two are not the same and should not be confused. Many “skeptic” arguments prey on this confusion, be careful.

The Body of Knowledge on Climate Sensitivity
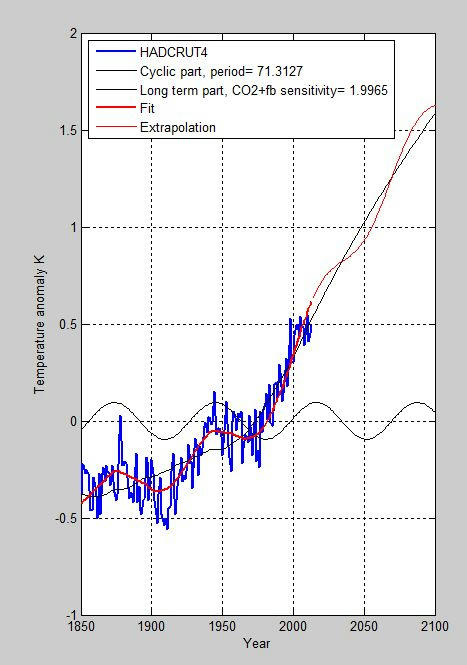
First, here’s a good list of the spectrum of peer reviewed literature addressing climate sensitivity. If you actually want to understand the topic (instead of cherry picking things that fit your viewpoint), it’s import to look at the body of work, that’s kinda how science works. Here’s a graphical representation, from AR5 WG1 Fig Box 12.2-1:
[image ]

To claim that a single paper can definitely set climate sensitivity, is false. While on the low side, Lewis and Curry 2014 does sit within the spectrum of other estimates.

Lewis and Curry 2014
Now to the paper itself. Lewis and Curry 2014 (LC14) is very similar to Otto et al 2013 (they both take the energy balance model approach), just with different heat uptake rates and reference periods.

LC14 has a heat uptake rate (0.36 Wm^-2) that is almost half of Otto et al 2013 (0.65 Wm^-2). The uptake rate used in LC14 comes from a single model, not an ensemble mean, and is, surprise, surprise, a very low value (which leads to lower ECS).

The ending reference period (1995-2011) was selected to “avoid major volcanic activity”. Although this seems odd considering Vernier et al. 2011 found that volcanic activity greatly affected the 2000’s. Furthermore, it is well known that the last decade has been a La Nina dominated period which would further add a cooling bias to their ending reference period, and thus artificially lower their ECS and TCR estimates.

Now new evidence (Durack et al 2014) suggests that “observed estimates of 0-700 dbar global warming since 1970 are likely biased low. This underestimation is attributed to poor sampling of the Southern Hemisphere”. Using the results of Durack et al 2014, the ECS would rise (15% according to a tweet from Gavin Schmidt).

The paper makes no mention of Cowtan & Way 2013 which demonstrates and corrects the cooling bias in HadCRUT caused by a lack of coverage in the heavily warming Arctic. Therefore, much of the recent warming which is occurring in the Arctic is unaccounted for in this paper. This would cause an artificially lower value of ECS and TCR.

The paper also ignores Shindell 2014 and Kummer & Dessler 2014 (most likely because they are too recent). Both of these papers highlight the inhomogeneities in aerosol forcing which may cause energy balance models to underestimate ECS and TCR.

Finally, the rather simplistic technique used in LC14 (and Otto et al 2013 as well) ignores all non-linearities in feedbacks and inhomogeneities in forcings. The exclusion of these elements leads to a lowering bias in TCR and ECS. Due to the fact the sample period and technique used introduce lowering biases into the results, LC14 may be useful in establishing the lower bound of sensitivity but in no way offers a conclusive value for the median or best estimate.

It should be noted that the results of Lewis and Curry 2104 implicitly accept and endorse the core of the Anthropogenic Climate Change theory; namely that increases in atmospheric CO2 will result in increases in global temperatures and that feedbacks will amplify the effect. For example, if you feel that the recent rise in global temperatures is due to land use changes and not CO2, then the TCR and ECS to a doubling of CO2 should be near zero. Or, if you feel that "it's the sun" and not CO2 then the TCR and ECS to a doubling of CO2 should be near zero. The recent change in climate is "just natural" and not CO2 you say? Well then TCR and ECS should, again, be near zero. So, if you've found yourself claiming any of the preceding and now find yourself trumpeting the results of LC14 as proof for your side, then you, unfortunately, are deeply confused. If you want to accept LC14's value for TCR of 1.33 K as THE value for TCR (which it isn't), then you also accept that majority of global warming is due to anthropogenic CO2 emissions.

What About Other Papers that Claim Lower Sensitivity?
As I stated from the outset, Lewis and Curry 2014 is hardly the only paper to address climate sensitivity. Beyond that, it’s hardly the only paper to suggest that climate sensitivity is on the lower end of the IPCC spectrum. I’ve addressed a few already but there are more (Lindzen 2001, Spencer & Braswell 2008, etc.). However, almost all of these papers have been found to have some significant flaws that cast doubt on their conclusions. Various peer reviewed rebuttals to these papers are listed below. I’d welcome readers to review the rebuttals and the original authors response to them.
[image ]

...But What if Climate Sensitivity WAS Lower Than Expected
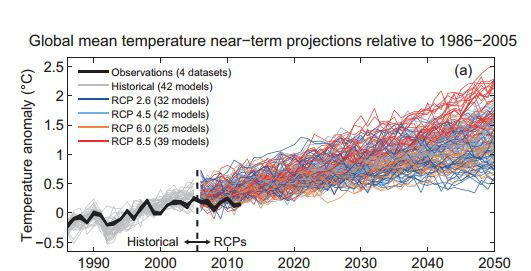
Let’s ignore all this for a second and pretend that, with Lewis and Curry, we can definitively say that climate sensitivity is lower than expected. Then what? Does this completely debunk the ACC theory? Does this mean rising CO2 levels really aren’t a concern? Well, many “skeptics” would say “YES!” but they do so without ever actually examining the issue.

According to Myles Allen, head of the Climate Dynamics group at Oxford:
Myles Allen said:
A 25 per cent reduction in TCR would mean the changes we expect between now and 2050 might take until early 2060s instead…So, even if correct, it is hardly a game-changer…any revision in the lower bound on climate sensitivity does not affect the urgency of mitigation
.

The issue is that, with atmospheric CO2 levels rising as quickly as they are, a lower TCR does not mean anything significant. It just means that the effects will be delayed slightly. So even if “skeptics” were correct in saying that climate sensitivity is definitely at the lower end of the IPCC range (which they’re not), it would have no substantial impact on future global temperatures or the need to control CO2 emissions.

So, Lewis and Curry 2014 is:
1) Inconclusive to definitely say that climate sensitivity is on the low end of the IPCC spectrum
2) The results are suspect and appear to include numerous biases that would lead to lower TCR and ECS
3) Even if it were conclusive and accurate, it would still not suggest that reductions in CO2 emissions are unnecessary. In fact, it adds to the scientific body of knowledge that temperatures will continue to rise to unsafe levels if we continue with the status-quo, just maybe a decade later than other estimates.

(Note: I’ve started this new thread to discuss climate sensitivity specifically. It is an important topic that popped up in another thread and I felt it merited its own discussion. I would, as much as possible, like to keep the conversation on this subject…although this is likely wishful thinking)
 
Replies continue below

Recommended for you

Just went on Laframboise's website:

That website is exactly the sort of thing I expected. I accidentally bought a Washington Times one time thinking it was a real paper. It doesn't take long to pick out the difference between partisan screeds and reasonable journalism.
 
Sure. let's start with the definition of a scientific theory

"A scientific theory
A scientific theory is a well-substantiated explanation of some aspect of the natural world that is acquired through the scientific method and repeatedly tested and confirmed through observation and experimentation."

In my opinion the theory of climate change does not exist, what you have is a ragbag of hypothesese, some may turn out to be accurate, some won't.

So, if you really think there is a theory of anthropogenic climate change, it needs to be well substantiated, repeatedly tested, and confirmed in the real world.

E=m.c^2 is a theory. "The polar bears are all going to die because Al Gore flies in bizjets" is not.


Cheers

Greg Locock


New here? Try reading these, they might help FAQ731-376
 
GregLocock,

e=mc^2 is a formula. Special Relativity is a theory.

You seem to suggest that all theories must have a singular equation that expresses the theory mathematically, otherwise it’s not a theory in your mind. In which case, I can only assume that makes you a creationist (i.e. this would negate the theory of evolution as a “theory” in your mind).

Beyond that, your expansion of the Wikipedia definition of a scientific theory is certainly not that used by many scientists. Do you consider string theory to be a theory? M-theory? Pretty much every theory in cosmology? If climate change doesn’t satisfy your definition of a “theory”, then certainly neither would any of these. This would put you at odds with pretty much the entire physics community. While many may disagree with the string theory and m-theory, they nevertheless see no qualms with calling them theories. The same is true for the anthropogenic climate change theory.

But all of this is rather silly semantics aimed to discredit the ACC theory. At the end of the day, you can call it whatever you want. I’ll call it a theory, which is certainly consistent with how the term is used in other areas of science.

That aside, you’ve failed to answer my question on what numbers you want me to provide to aid in my definition of the ACC theory. So I’ll try and repeat myself:

Anthropogenic Climate Change Theory states that the rise in global average temperature observed during the latter half of the 20th century is primarily (75%-100%) due to anthropogenic CO2 emissions (note that >100% is possible due to cooling affects of aerosols and other forcings). Continued increases in atmospheric CO2 concentrations will lead to more warming. A doubling of atmospheric CO2 concentrations (using a baseline of 280 ppm) is expected to result in a future rise of 3 deg C (using a baseline of 1851-1900).

Testing the Theory
Firstly, it is the only theory capable of describing and reproducing the observed changes in the latter half of the 20th century. The sun, “force X”, geothermal flux, land use changes, orbital/tilt variations and natural ocean cycles have been examined but fail to explain the climatic variances noticed. I’d welcome readers to review the scientific literature or my previous posts for more information on this. Again, I’d remind readers that the strength of the ACC theory is not that there is no other theory that explains the 20th century changes but that anthropogenic CO2 does explain the changes so well.

Now to the accuracy of the ACC theories predictions, which is the bone of contention for most. The climate models have done a good job at predicting temperature trends as long as stochastic and unpredictable factors such as ENSO events, volcanoes and aerosols match the predictions of the models. The recent short term divergence between models and observations is primarily due to the short term effect of ENSO events and higher than predicted aerosols. The divergence does not appear to be because sensitivity estimates are too high, land use forcings are incorrectly estimated, solar forcing has been under represented, etc. In other words, climate models have failed to predict that which they were never expected to predict and that which (other than increasing anthropogenic aerosols) will have no long-term climatic effect. Nothing core to the ACC theory is threatened by this short term divergence. (my post at 4 Apr 14 17:45, Kosaka and Xie 2013, Schmidt et al 2014, Foster and Rahmstorf 2011, England et al 2014, Rigby et al 2014, Huber and Knutti 2014). Despite the heavy influence of short term variability recently, observations do lie within the range of models.
[image ]

Furthermore, when you account for the the short-term variability, model accuracy improves even more.
[image ]

Impacts and Policy
I consider the resulting impact of a 3 deg C rise as separate extension to the ACC theory, as is the policy regarding mitigation and/or adaptation. These are more economic, political and social issues which are separate to, but also the result of, the question of climate change. So while they are part of the same conversation, I don’t lump these in with what I consider the ACC theory. However, there is much research on both these topics. The majority of which suggests that mitigation is required to avoid future economic losses and social, political and moral hardships. I’ve included papers and research supporting this position above. I’ve heard almost nothing but unjustified opinions from those here that express an alternative viewpoint. Your welcome to reference Tol’s papers…although, given the amount of evidence discrediting his papers, I’d recommend against it.

All,
Is this a satisfactory definition of the ACC theory? Well, I expect you disagree with the statements but is this what you were looking for me to explain, from my perspective? Can we now go back to discussing LC14 and climate sensitivity? Perhaps TGS4 would care to defend his inclusion of Harde 2014? I’m sure he applied equal skepticism to Harde 2014, after reading about it at WUWT, then he does to other aspects of climate science which he is skeptical of.
 
E=m.c^2 is testable, confirmed and well substantiated.

"You seem to suggest that all theories must have a singular equation that expresses the theory mathematically". I did not. Straw man.

I'm afraid your spaghetti plots aren't a theory, any more than this exercise in curve fitting is. They aren't based on physics, or more accurately, they have gains in them that are used to improve the fit away from what straightforward physics would say. These gains are supposed to account for unknown feedback effects, but of course since they account for unknown effects, they are merely tunable eye candy.

f8g2bfqwf8bx3gd6g.jpg


Cheers

Greg Locock


New here? Try reading these, they might help FAQ731-376
 
You called E=mc^2 a theory which seemed to suggest you confused equations with theories. I can't really be accused of a straw man when I'm doing my best to work off your errors.

Feedbacks are based on physics. To say otherwise is just plain false and nothing more than a deliberate attempt to swear some dirt onto climate science. There is tremendous amounts of research that goes into them and how they are modeled. For example, the AR5 WG1 chapter on radiative forcings has 10 pages (two columns per page) of references. Clouds and aerosols chapter has 22 pages of references. This is not just blind tuning as you have been lead to believe and attempt to lead others to believe.
 
We've already established they are adjustable gains. If you are fitting a model and allow yourself adjustable gains then you don't have a theory, you have eye candy. Sure there are attempts to quantify these feedbacks, but at the moment they have a wide variety of positive and negative feedbacks to choose from, and can select which are used for a model by adjusting the gain of each. While, eventually, that may work, it will need a lot more data with signal than we have, given the parts of the total system that are currently incalculable.

Cheers

Greg Locock


New here? Try reading these, they might help FAQ731-376
 
And we’ve also already established they are adjustable only within a range that is consistent with observations and research. Furthermore, while the end goal is better matching of historic temperatures, the parameterization is already locked prior to running a GCM. Therefore, the tuning is only to represent the subsystem more accurately and is done before they know how well they will reproduce historic temperatures.

Granted, if a model diverges wildly from historic temperatures, it will be considered a failure and require reanalysis. However, the model is examined to pick out which subsystem contained errors which lead to the divergence and that subsystem is examined to see if it can be represented better.

For example, cloud parameterization, an area with high uncertainty, is not adjusted blindly such that it produces a more accurate temperature reconstruction. It is adjusted such that it represents the physics of cloud formation and dynamics as close to observations and research literature as possible. An example of this is [link Sherwood et al 2014, which analyzed how cloud formation was represented in models as compared to observations. They concluded that models which used stronger convective mixing, which leads to higher sensitivity, agreed with observations. Whereas, models which used weaker convective mixing, which leads to lower sensitivity, did not agree with observations. Again, there is 22 pages of such literature that goes into cloud parameterization. It is far from a guessing game but certainly not perfect.

You falsely characterize climate models as some sort of blind “curve fitting” exercise out of ignorance of the actual process (not out of lack of knowledge on modeling in general, I should note).

I would like to stress that climate models are far from perfect. For anyone to believe that I think otherwise, that would be a mistake. It’s an incredibly complicated process to model climate and they contain many simplifying factors and assumptions that lead to errors and uncertainty. Frankly, given the complexity, I’m continually surprised at how well the models do when you account for the unpredictable factors such as ENSO, volcanoes and human aerosols. This is a testament to the amount of research that has gone into this area. Yet more is to be done and the accuracy of the models and the predictions is likely to continue to improve. However, even near the lower end of the bound of uncertainty it still shows that increased levels of CO2 will lead to higher temperatures in the future.

In order for the skeptic’s “do nothing” position to be satisfying, there needs to be a drastic change in the current scientific understanding, not just hoping it to be on the low end of the uncertainty. This was a key point to draw from LC14 which I’ve pointed out (…bringing us back on topic…). Even making every assumption possible to push the sensitivity down as far as they could, LC14 still leads to a TCR of 1.3 K, which is high enough to require mitigation efforts to limit future temperature rises. Using LC14’s value for TCR instead of the IPCC value, future impacts would be pushed out by 10 years. While this would make mitigation efforts more manageable, it still requires mitigation efforts.
 
Can either side of this argument help me out? I have never seen timeline data sampling that statisticians would consider significant. The Earth is 4.5 billion years old, yet we argue about data from the last 50-150 years to prove both sides of this argument. This is such a small sampling, it is ludicrous. Does anyone have better data that would show longer term trends? We have ice core samples that go back 800,000 years. This is still insignificant statistically, but it is better that what I have seen. I am not aware of any other method to get reasonable data further back from that. What else is out there?
 
Hawkaz, although it is off topic, I appreciate you asking a sincere question. I will provide an answer but I hope it doesn’t derail the conversation away from sensitivity.

The question you have to ask is: is it relevant to the problem at hand? Are temperatures from >800,000 years ago relevant to how changes in climate will affect humans today?

The issue is not whether the planet can handle higher temperatures or rapid temperature swings (it can, it has and it will continue to), the issue is whether humans and the modern biosphere, which humans are dependent upon, can. So temperatures from well before the evolution, development and prosperity of humans are rather unimportant. Furthermore, Earth was a volatile place in its infancy. The relevancy of Earth’s climate 4 billion years ago to today is about as strong as the relevancy to Mercury’s climate today. What is important is that major climatic changes in Earth’s history are accompanied by mass extinctions and drastic changes in the biosphere and topology of the planet.

As I’ve said before, a 3 deg C increase in temperature (from pre-industrial levels) is not be unheard of in Earth’s past. However, while these temperatures were great for lizards, they were not great for mammals. Furthermore, I don’t believe that the dinosaurs were too terribly concerned with coastal flooding damaging their cities or changes in climate threatening their agricultural productivity. Less sarcastically, we’ve built up an impressive and complex civilization that is dependent on a stable long term climate to support it. So the data that matters, is the data that is relevant to humans – namely the Holocene. During the Holocene, where humans developed and civilizations began to flourish, we’ve had a fairly stable climate. The recent observed changes are unlike anything observed during the Holocene. Many feel that we are entering a new climatic epoch, dubbed the Anthropocene.

[image ]

If your question is gauged more towards the idea that “if climate has changed before, how do we know this isn’t just natural climatic changes?” then that’s a different story. First things first, climate doesn’t magically change. “Natural” climate change is often treated as random, uncaused change. This is obviously untrue but nevertheless appears to be appealing to some. Natural climate change has a cause – historically that cause has been orbital/tilt changes. However, orbital/tilt changes have a very small, very slow impact on climate. So, while these changes would initiate large scale, lasting changes in climate, they were not responsible for most of the change in terms of magnitude. CO2 release was a positive feedback, spurred by orbital/tilt changes, that lead to other positive feedbacks (water vapour, albedo changes, etc) that was responsible for the bulk of the warming in Earth’s past. It’s important to note, as it is relevant to this thread, that if Earth is not that sensitive to changes in CO2 (i.e. low ECS and TCR) then we cannot explain the past changes in Earth’s history. However, with higher values of ECS and TCR, we can accurate explain past climatic changes.

Below is a graph from Shakun et al, 2012 which illustrates how stable the Holocene has been coming out of the last glacial-interglacial transition. It also notes the relationship of CO2 (yellow dots) and global temperatures (blue line). Note that a 3.5 deg C rise occurred over a period of ~8,000 to ~10,000 years.
[image ]

With regards to recent changes in climate, orbital/tilt changes are far too slow an far too weak (and not expected to have an impact for thousands of years) to account for the rate and extent of the observed changes. Furthermore, solar activity has been moving in the opposite direction of global temperature since ~1960. Other factors, such as geothermal flux, land use changes and oceanic cycles (AMO/PDO), have also been studied but fail to explain the recent changes.

Does this answer your question? Let me know if you’d like me to clarify anything.

TL;DR – temperature variances in Earth’s early history are irrelevant because the question at hand is how will future temperature changes affect the biosphere that modern humans are dependent upon and built their civilization around during the Holocene.
 
i think rconnor glossed over the moderately obvious point that we don't have a temperature record for much more then 20+ years (satellite records ... land based temperature records are somewhat suspect). beyond that you're using proxies (ok, he does show a graph with "proxy global temperature" on it). what this means is we're deducing the temperatures based on some other measurement (be it tree rings, oxygen isotopes, ...) and this deduction is not fully accepted (ok, the skeptics argue about it; the scientists doing the math argue about it with much more insight and knowledge, most everyone else accepts it as gospel). we might have a better record of CO2 levels , but i haven't thought about it, or researched it, that much.

an observation from rconnor's graphs would be that they seem to downplay what we know of the middle age warm period (when they settled Greenland, grew grapes in England) and the little ice age (when they were skating on the Thames). ok, there are small changes ... but Greenland today doesn't look very hospitable, although the global temperature is higher ...

another day in paradise, or is paradise one day closer ?
 
The reason I stopped looking at whetehr ENSO affected global temps over the last 500 years is that most of the ENSO record is proxies, and most of the global temperature record is proxies ,and you guessed it, some of the same proxies are used in both series. So ultimately any attempt to find a signal in their relationship was a long winded way of seeing how many of the same proxies had been used, which was a long way from what I was interested in.

The 'historical temperature record' should always be called a reconstruction, or a model, it is not a historical record. Even HADCET is a model.


Cheers

Greg Locock


New here? Try reading these, they might help FAQ731-376
 
I described the IPCC graph as a spaghetti graph, that is a little unfair as it confounds three different sets of variability.

Firstly it shows some predictions from the first (FAR) second (SAR), and third (TAR) reports, and then 3 scenarios from the 4th report (AR4).

So, first you have the models, which will have been trained over different sets of data in their hindcast or training period, then you have the period where the models run free, using measured levels of CO2 etc to drive them, in which we can examine the correlation , and then finally the models response to various estimates of the future CO2.


Actually it is a spaghetti graph as it is impossible to determine which model is in which portion of its hindcast/correlation phase.

it's p63 in the 363 MB download
Anyway, here is a much better graph from the same paper, p87.

p12ewi93x9fxv7l6g.jpg


Cheers

Greg Locock


New here? Try reading these, they might help FAQ731-376
 
whilst i can't make too much out of the RCP side of the graph (other than the obvious, models are predicting higher than observations), my 2c ...

1) why do we call it "temperature anormaly" ... when we know it's really temperature increasechange relative to some datum?
2) why isn't there a standard datum ? ... 'cause every report wants to set itself apart from the others ?
3) whilst it's hard to see individual model predictions, i see a much more dynamic graph on the left compared with the reasonably monotonic right side ?
4) how quick untill someone mentions ... "the pause" ?

another day in paradise, or is paradise one day closer ?
 
“we don’t have a temperature record for much more then 20+ years…beyond that you’re using proxies”

If you meant to say, “Anything before 1994 is a proxy”, you are wrong. Very wrong.

Most modern instrument records date back to 1850, however the accuracy of the 19th century data is suspect. Regardless, to call temperature data prior to the use of satellites (which was in the 70’s not the 90’s by the way) “proxy” is rubbish. It’s simply a case of “skeptics” going “I don’t like the facts, they must be false”. Despite claims made at a weather man’s blog, UHI does not have a significant impact on the temperature record as demonstrated by Berkley Earth and Space Team (BEST) and Li et al 2004, Jones et al 2008, Hausfather et al 2013, etc. Regarding the imprecision of measurements, this article explains how the size of the data set helps the overall precision.

The only thing I’ll say about the “hockey stick” is Mann et al 1998 was shown to have some issues with the statistical method used but, and the point that “skeptics” conveniently forget, the major results were still confirmed. Numerous paleoclimate studies have been conducted since Mann et al 1998 and they are in general agreement with each other – the recent rise in temperature is unlike anything seen in the Holocene. So, toss out Mann et al 1998 if you like, it doesn’t change a thing.

At this point, some may point to HadCET as a counter point. CET stands for Central England Temperature and that’s exactly (and all) that it is. While HadCET roughly agrees with BEST data, it contains wild year-to-year variability which is what you’d expect (and the problem with) taking such a small regional sample. For example, 2010 was the hottest year on record globally but it was the coldest year since 1986 for HadCET. So, while HadCET may have shown warm temperatures in the MWP, it is not indicative of the global temperatures. Furthermore, the warming during the MWP coincides with natural warming factors. The same natural factors were in a cooling phase during the recent warming. So not only was the MWP not as warm as today globablly, even if it was it would fail to explain the recent warming. In fact, it would suggest that the recent warming is even more anomalous.

I agree with Greglocock that paleoclimate temperature sets from earlier in the Holocene should be called “reconstructions”.

rb1957,
1) It’s an “anomaly” compared to the baseline. So it’s the exact same thing as a “change relative to some datum”.
2) I do agree there should be a standardized baseline period but it usually doesn’t matter because people talk about temperature change within some period. For example, when someone says “there’s been an X degree rise since 1970”, it doesn’t matter whether the data uses a baseline of 1951-1980 (used by NASA normally) or 1961-1990 (used by IPCC normally). Furthermore, the baseline selected does not influence the shape of the graph, which is really the important aspect of climate change. When people talk about temperature rise “since the pre-industrial period”, where the baseline does matter, the baseline is usually 1851-1900.
3) Left (hindcast) models have unpredictable elements such as ENSO, aerosols (anthropogenic and natural) input into them. Right (forecast) models do not and estimate what those might be. In the long run, these effects have little impact as they are either short term (volcanoes) or oscillate between warming and cooling (ENSO/PDO). So the “dynamics” you see in the hind cast is internal variability, while that is smoothed out in the forecasts.
4) The real question is How long until someone actually tries to substantiate or defend the “pause” as a valid argument against the 15+ times I’ve detailed why it’s not valid?…I’m not holding my breath on this one.


This takes us further away from the topic at hand, so let me repeat myself:
rconnor said:
In order for the skeptic’s “do nothing” position to be satisfying, there needs to be a drastic change in the current scientific understanding, not just hoping it to be on the low end of the uncertainty. This was a key point to draw from LC14 which I’ve pointed out (…bringing us back on topic…). Even making every assumption possible to push the sensitivity down as far as they could, LC14 still leads to a TCR of 1.3 K, which is high enough to require mitigation efforts to limit future temperature rises. Using LC14’s value for TCR instead of the IPCC value, future impacts would be pushed out by 10 years. While this would make mitigation efforts more manageable, it still requires mitigation efforts.
 
I misused hindcast in my previous. The three phases are learning/training, where the gains etc in a neural network or other adaptive system are being trained to follow the real data, hindcasting/testing, where the performance of the model is tested using data that was not part of the training set, and then forecasting/extrapolation, where the model is being used to predict some future state on the basis of modelled inputs.

If a model is stable and robust then it is useful to explore the sensitivity of the model to the break between learning and hindcasting. I'll do that on Tuesday on my silly curve fit to illustrate how it works. There is a more robust solution which I was taught as k-fold, in which you break the data set into k subsets, and then use various permutations of the k subsets for learning and testing.

That may not be appropriate for a model which relies on the previous years state as a basis for the current year, obviously the only memory in my silly curve fit is the year and the current co2 level, so it doesn't need to know what happens in the previous year. That is it will give an estimated temperature anomaly for any given date and co2 ppm.

Cheers

Greg Locock


New here? Try reading these, they might help FAQ731-376
 
So to answer your question "3) whilst it's hard to see individual model predictions, i see a much more dynamic graph on the left compared with the reasonably monotonic right side ?"

Up until 2005 they are in their training and possibly hindcast phase. Due to the obfuscation of the chart you can't tell which, which is crucial. My guess is that they are training right up to 2005. from 2005 onwards they are using various predictions of CO2 levels.

If someone displays good correlation in the training phase it means either their model is good, or that they had enough knobs to turn. It is not in itself a guarantee of usefulness.

If someone displays good correlation in the hindcast or testing phase then they are demonstrating that the model is good at predicting outcomes for a given input set, and hence may be useful for predictions.

Therefore it is vital to differentiate between training, hindcast and forecast modes. Note what happens if you run no hindcast -you have no independent test of the model.


RCPs are different projections for CO2 etc concentrations, so they've driven eacch model with 4 different RCPs during the forecast phase. That's why the spread increases from 2005 onwards, up until then they use one set of historical record, then each is run for each of 4 scenarios. The danger is when people get a thick texter and draw a line through the middle of the spaghetti. GIGO.


Cheers

Greg Locock


New here? Try reading these, they might help FAQ731-376
 
As to whether HADCRUT4 etc are data or models, let's read the very first para of the paper


Recent developments in observational near-surface air temperature and sea-surface temperature
analyses are combined to produce HadCRUT4, a new data set of global and regional temperature
evolution from 1850 to the present. This includes the addition of newly digitised measurement
data, both over land and sea, new sea-surface temperature bias adjustments and a more
comprehensive error model for describing uncertainties in sea-surface temperature measurements.


and a bit later on

with land data in unobserved regions reconstructed
using a method known as empirical orthogonal teleconnections


Which doesn't sound like JimBob went to his stephenson screen and wrote down the max min readings every day, to me

I'm not actually fussed by this aspect of it, but it does mean that any claims of a data driven temperature record back to 1850 should be taken with a large pinch of salt. Perhaps we merely differ in our definitions, by a model I mean data +assumptions, whether it is homogenizing, rebaselining, or as in the second quote, calculated from surrounding data.

This para also indictaes that swallowing the dataset whole might bite you

The differences in temperature analyses resulting from the various approaches is referred to as
“structural uncertainty”: the uncertainty in temperature analysis arising from the choice of
methodology [Thorne et al., 2005]. It is because of this structural uncertainty that there is a
requirement for multiple analyses of surface temperatures to be maintained so that the sensitivity of
results to data set construction methodologies can be assessed. The requirement for any given
analysis is to strive to both reduce uncertainty and to more completely describe possible uncertainty
sources, propagating these uncertainties through the analysis methodology to characterize the
resulting analysis uncertainty as fully as possible.


and of course there's this. This is good honest stuff, they've made some choices, and they need to understand what the resulting errors are

The assessment of uncertainties in HadCRUT4 is based upon the assessment of uncertainties in the
choice of parameters used in forming the data set, such as the scale of random measurement errors
or uncertainties in large-scale bias adjustments applied to measurements. This model cannot take
into account structural uncertainties arising from fundamental choices made in constructing the data
set. These choices are many and varied, including: data quality control methods; methods of
homogenization of measurement data; the choice of whether or not to use in situ measurements or
to include satellite based measurements; the use of sea-surface temperature anomalies as a proxy for
near-surface air temperature anomalies over water; choices of whether to interpolate data into data
sparse regions of the world; or the exclusion of any as yet unidentified processing steps that may
improve the measurement record. That the reduction of the four data sets compared in Section 7.4
to the same observational coverage does not resolve discrepancies between time series and linear
trends is evidence that choices in analysis techniques result in small but appreciable differences in
derived analyses of surface temperature development, particularly over short time scales.


Figure 8 here
CompoFig1.png


shows what I'd expect to see, modern estimates have small error bounds, but even as recently as 1910 the total 95% confidence interval across both data sets is +/- 0.4 deg C for some years. It would be terrific to see the same graph back to 1850, and I wish they'd use an 11 (or more) year moving average rather than annual, I am not bothered by annual errors in the least.

Cheers

Greg Locock


New here? Try reading these, they might help FAQ731-376
 
If nothing else, it pisses me off when someone states the debate is over, and congress debates and concludes for that time that it isen't so. And then to continue as if congress dosen't matter in the enacting of the laws. I just don't like some of these behind the scenes movements that can state the debate is over before the debate has even started.

How many of these posts have happened after the "debate" was declared over?
 
"How many of these posts have happened after the "debate" was declared over?" ... pretty much all of them, IPCC delcared "game over" back in 2007.

"temperature anormaly" ... i queried this term based on the onomatopoeia of "anormaly" ... there's nothing anormal with temperatures changing, but the word anormaly suggests there's something wrong, anormal.

another day in paradise, or is paradise one day closer ?
 
Status
Not open for further replies.
Back
Top