Eng-Tips is the largest engineering community on the Internet

Intelligent Work Forums for Engineering Professionals

how can i check deviation between a point cloud/group and a sheet?

Status
Not open for further replies.

dbharness

Mechanical
Aug 7, 2013
32
0
0
US
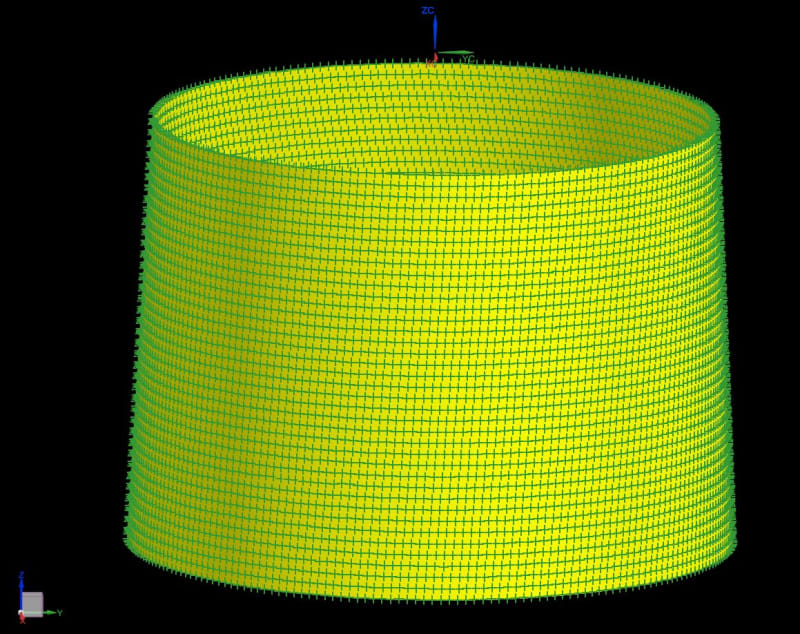
We have extracted implants from patients and need to compare them to our NX parts LMC condition. Our quality department scanned the extracted parts and sent me an IGS of points.

1. I have tried surface > fit surface with not luck.

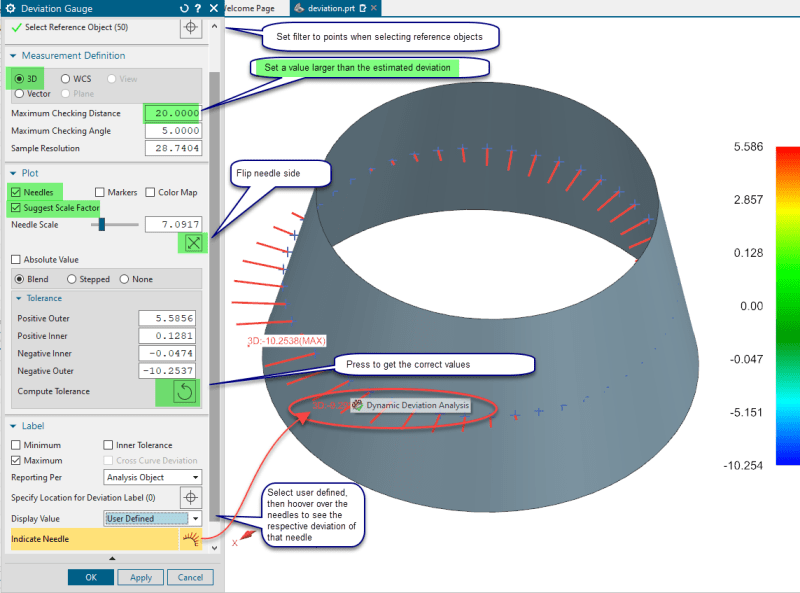
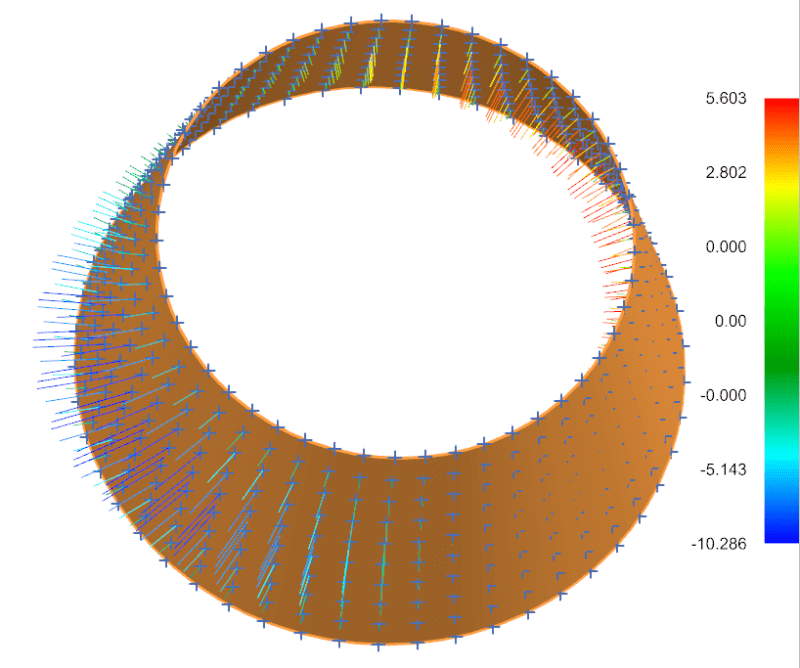
2. I have tried Deviation Gauge, checking the points to my LMC Sheet? mixed results. I am not getting any useable data. I dont use this tool much, so i could have it set up wrong.

We have NX 11.0.2.7. The Quality engineer had PCDMIS can export the point cloud in .XYZ, .IGES and .PSL.

What suggestions do you have?

Thanks
David
 
Replies continue below

Recommended for you

I understand that your real models are secret and cannot be shared, but can you put together some illustration model of this ?

Preferably both an image and maybe an NX model .

Without looking, I would assume that the Deviation Gauge should produce a decent deviation plot.


Regards,
Tomas

 
analysis_pammzk.jpg
 
The Deviation Gauge is not that simple to explain with few words...
here's an image which hopefully gives some lead.
I have a set of points which deviate from the surface , I reduced the number of points to these 50 for clarity of the illustration. The second image is 500 points and shows both the color scale and the colored needles.
When selecting the reference objects , use a selection filter else you will also be comparing the distance to the local edges etc.
And , you MUST set the "maximum checking distance" to a value larger than you max deviation, else those "worst cases" will be ignored.
When you have selected the objects, tick the "compute tolerance" to receive the correct values.

image_phshw9.png

image_bxi2ex.png


Hope this clarifies the function somewhat.

Regards,
Tomas
 
That helped a lot. I think i have the deviation gauge tool figured out. Thanks

Now, how can i get a report? I see that it shows max in the information window, but can i get max and min or all deviations in a text format?
 
you can, but I'm not sure I like the format.
Select the analysis object, then press Ctrl+I ( Info Object)
I have not seen a better report than this but I might have missed it.


Status
Not open for further replies.
Back
Top