Eng-Tips is the largest engineering community on the Internet

Intelligent Work Forums for Engineering Professionals

  • Congratulations waross on being selected by the Tek-Tips community for having the most helpful posts in the forums last week. Way to Go!

How to interprete the FRF phase and imaginary plots?

Status
Not open for further replies.

onemilimeter

Electrical
Jul 25, 2009
54
0
0
GB
The following information was extracted from this article:


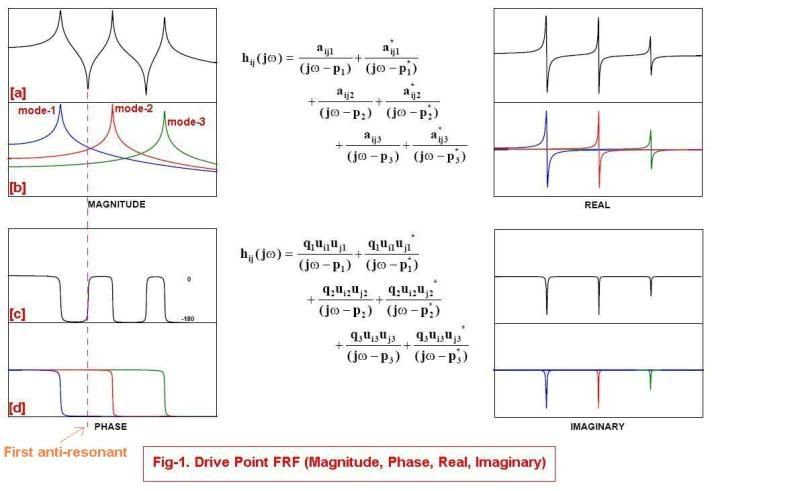
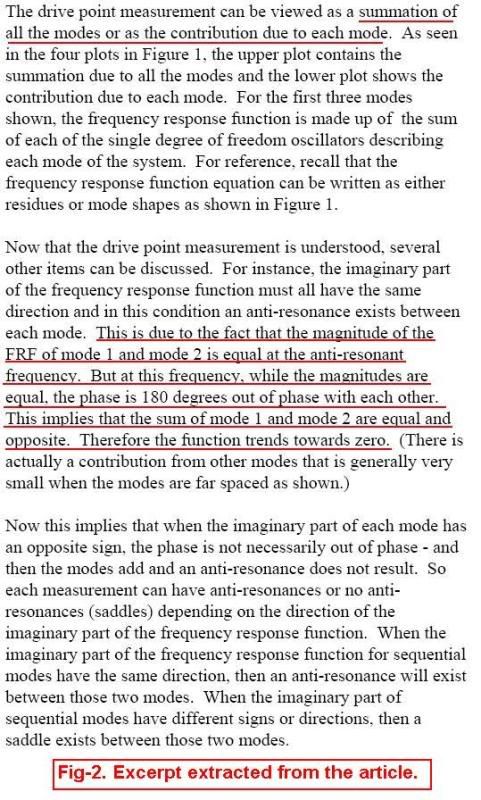
Kindly refer to Fig-1 and Fig-2. As stated in Fig-2:
"...This is due to the fact that the magnitude of the FRF of mode 1 and mode 2 is equal at the anti-resonant frequency. But at this frequency, while the magnitudes are equal, the phase is 180 degrees out of phase with each other. This implies that the sum of mode 1 and mode 2 are equal and opposite. Therefore the function trends towards zero..."
I try to understand the statement with the help of Fig-1[c] and Fig-1[d]. But I still don't understand why "the sum of mode 1 and mode 2 are opposite... and how this cause the function trends towards zero". Does the author mean the FRF trends towards zero? I also do not understand, with the help of Fig-1[d], why does the summation phase (in Fig-1[c]) change from -180 to 0 degree at first anti-resonant point?


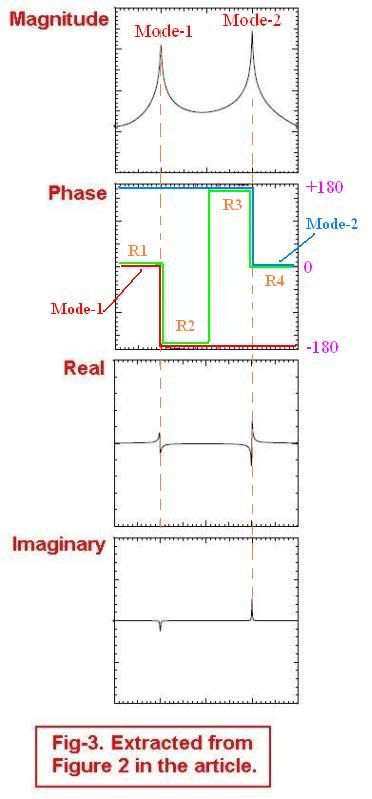
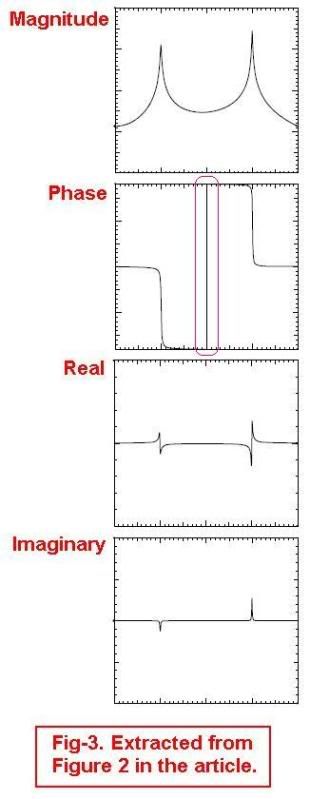
Kindly refer to Fig-3. I also don't understand why the phase (the edge bounded by a 'pink rectangular') changes from -180 to 180 degree as show in the phase plot?


Thank you very much


oct03-1v2.jpg


oct03-2.jpg


oct03-3v1.jpg
 
Replies continue below

Recommended for you

The phase of the first mode is zero before the resonance, and 180 after. ditto the second mode. so between the resonance of the first and the second the two are 180 out of phase. where their magnitude lines cross, they are thus equal and opposite.

I think you'll find that it changes from 360 degrees to zero in the red box, not 180.


Cheers

Greg Locock

SIG:please see FAQ731-376 for tips on how to make the best use of Eng-Tips.
 
Hi GregLocock,

Thanks for your reply.

In your reply, you mentioned that "... where their magnitude lines cross, they are thus equal and opposite." Can I say that because of "... and opposite", the effective magnitude, as shown in Fig-1[a] drops or "trends" to zero? By the way, how does mode-3, especially its phase, affect the formation of the first anti-resonant peak?

I agree with you that, in the red box in Fig-3, the phase changes 360 degrees (or from -180 to 0, and from 0 to +180). Can we explain using the similar approach applied in Fig-1? I still could not understand why the phase changes 360 degree in the red box, but it changes only 180 degree at the first anti-resonant region in Fig-1. Kindly advise.

Thank you very much
 
I haven't read the article closely. My guess is that the 360 phase change is probably a plotting artifact. It is really a zero phase change.

Based on pole-zero diagram of general lightly damped MDOF systems, we expect only 180 degree phase changes ...unless there exists a double-pole or double-zero.

=====================================
Eng-tips forums: The best place on the web for engineering discussions.
 
The residual of the third peak does contribute slightly to the first antiresonance but not much as its magnitude is small at that frequency.

In the second plot the two modes are out of phase so the antiresonance between them is composed of two vectors that are in phase (roughly), hence don't cancel.

I think you need to spend some time with a textbook and a calculator rather than just asking here, the superposition of SDOF modes is relatively straightforward.


Cheers

Greg Locock

SIG:please see FAQ731-376 for tips on how to make the best use of Eng-Tips.
 
Thanks electricpete and GregLocock. Based on your comments, I tried to sketch the individual phase plots for Mode-1 and Mode-2 in Fig-3 (or modified as below). Let's say RED curve is the phase plot of Mode-1, BLUE curve is the phase plot of Mode-2, and GREEN is the effective phase plot. Please correct me if my plot is wrong. If my plot is correct, I'm wonder why at R1, when Mode-1 and Mode-2 are out of phase 180 degrees, why the effective phase follows the phase plot of Mode-1 instead of that of Mode-2. Ditto to that at R4 as well.

To be frank, when I was given this task (i.e. impact hammer test) earlier, I really did not know how to start and where to start at the beginning as I don't have any related background knowledge. Once I obtained the experimental results, I really did not know how to interpret them, let alone to tell if those measured results were correct or not. Fortunately, there are many nice forumers here who have helped me a lot. I really appreciate for all your help and advices. At least now, I start to appreciate these words, e.g. "modal analysis", "resonance frequency", "vibration mode shape", "impact hammer test", etc., which were "alien" to me at the beginning. However, my fundamental knowledge is not strong enough yet and as GregLocock suggested, probably a textbook or reference book will help me to understand the mathematics behind this topic. I will be glad if someone will recommend me a book, which does not explain the concept using complex mathematics, but in a more simple approach, to help beginner to appreciate the theories of this topic.

Thank you very much

Fig-3-Modified.jpg
 
Let's say RED curve is the phase plot of Mode-1, BLUE curve is the phase plot of Mode-2, and GREEN is the effective phase plot. Please correct me if my plot is wrong. If my plot is correct, I'm wonder why at R1, when Mode-1 and Mode-2 are out of phase 180 degrees, why the effective phase follows the phase plot of Mode-1 instead of that of Mode-2. Ditto to that at R4 as well.
I have read the paper closer and I'm still pretty sure the 360 degree change is an artifact.

I think it convenient to imagine that each lightly damped peak has a "polarity". As Greg said, consider the polarity to be the sign of the transfer function of the mode immediately to the left of the peak.

If it is a driving point impedance (point of measurement is same as point of force), then all peaks have the same "polarity". This can be inferred by recognizing that each peak in driving point impedance represents a simple SDOF lightly damped system. For a SDOF system, the displacement is in-phase below resonance and lags by 180 degrees above resonance. More generally and two sets of modes which have the same sign residue have the same polarity.

Let's assume the first resonance has simple positive (*) polarity and 2nd resonance also has simple positive polarity (*by positive polarity I mean just like SDOF, response is positive in-phase below resonance and negative out-of-phase below resonance). In the area just above first resonance, we know the response is dominated by the 1st resonance and so the FRF is negative. In the area just below the 2nd resonance, we know the response is dominated by the 2nd resonance and so the FRF is positive. So we know there has GOT to be a zero (antiresonance) between the 1st and 2nd resonance as the response turns from negative back to positive. And so it is for any two adjacent modes with same polarity we need a zero between. If two adjacent modes have opposite polarity, then no zero in between.

The total response is generally governed by only the two closest peaks. So for driving point impedance where each peak has the same polarity, we have zero's between all modes. This behavior can be seen on all the diagonal graphs of figure 2 which represent driving point impedances where you can see the "sharp" bottoms representing zero's (anti-resonances). In contrast the non-driving point (off-diagonal) graphs for this system have flat bottoms representing minima (saddle points) where adjacent peaks have opposite polarities and therefore no sign reversal is needed between peaks. I don't think it is always the case that off-diagnoal elements necessarily have saddle points as opposed to zero's (is it?).

Now let's look at the off-diagonal graphs of figure 2. They all have only 2 peaks. I believe it is a general property that by performing a cross-impedance measurement (excite and monitor at different points), we always reduce the degrees of freedom of the equivalent system as seen at the terminals where we measure / excite. (Maybe someone can comment further). At any rate it seems pretty obvious the two peaks have opposite polarity (you can see his imaginary portions have opposite sign). So there is no sign reversal required between peaks and we have a simple saddle point. The 360 degrees is a plotting artifact. If you didn't have it you would decrease below the bottom of the scale so they needed a 360 degree correction to keep it on the scale.

As far as your phase plots, let's label the scale: –180 at the bottom, 0 in the middle, 180 at the top. I think your mode 1 phase plot is correct. I think your mode phase 2 plot drawn in blue shuld be drawn starting at the bottom of the plot and then transitioning to 0 at the mode 2 resonance. Then the composite (total) phase is 0 below mode 1, -180 between modes 1 and 2 and 0 above mode 2.

My terminology + and – is a little simplistic since actually we are dealing with a complex quantity. However for lightly damped systems where modes do not overlap this is more than adequate and simplifies the discussion to make it easier to understand (for people like me). In the paper you linked, he uses the sign of the imaginary part to play the same role that I have used for + and -.

That's the way I see it but I may be wrong. If so hopefully someone will chime in.

An interesting note about who decides to response to what question. I think it is human nature you will respond to a question that is interesting or challenging. FRF plots are not something I totally understand and so it's interesting to me. I guess for these other guys it is old hat. Another aspect of human nature I observe on the forums, people are more likely to chime in to prove someone wrong than to help someone asking a question. That's fine also... I think I would do it myself if the question and incorrect response seemed trivial to me. If such is the case here I look forward to someone telling me if I'm wrong... maybe I'll learn something.

=====================================
Eng-tips forums: The best place on the web for engineering discussions.
 
I believe it is a general property that by performing a cross-impedance measurement (excite and monitor at different points), we always reduce the degrees of freedom of the equivalent system as seen at the terminals where we measure / excite.
This comment is limited to the context of discrete/lumped systems where the only choices for impacting/monitoring are the locations of the masses.

=====================================
Eng-tips forums: The best place on the web for engineering discussions.
 
electricpete said:
As far as your phase plots, let's label the scale: –180 at the bottom, 0 in the middle, 180 at the top. I think your mode 1 phase plot is correct. I think your mode phase 2 plot drawn in blue shuld be drawn starting at the bottom of the plot and then transitioning to 0 at the mode 2 resonance. Then the composite (total) phase is 0 below mode 1, -180 between modes 1 and 2 and 0 above mode 2.
That was a little bit off. Let me correct that in bold below.
corrected said:
As far as your phase plots, let's label the scale: –180 at the bottom, 0 in the middle, 180 at the top. I think your mode 1 phase plot is correct. I think your mode phase 2 plot drawn in blue shuld be drawn starting at the bottom of the plot and then transitioning to -360 at the mode 2 resonance. Then the composite (total) phase is 0 below mode 1, -180 between modes 1 and 2 and -360 above mode 2. We would need an extended scale to plot it, so there is a plotting wraparound from -180 to +180.

=====================================
Eng-tips forums: The best place on the web for engineering discussions.
 
Thanks electricpete for your detailed explanation. I really appreciate and, due to my poor background, I will need some time to go through your comments and digest them. I will come back soon...

Thank you very much
 
electricpete describes it pretty much as it is described in Ewins book (see page 123-128 in 2nd edition).

M

--
Dr Michael F Platten
 
I am having second thoughts about this one:
electricpete said:
I believe it is a general property that by performing a cross-impedance measurement (excite and monitor at different points), we always reduce the degrees of freedom of the equivalent system as seen at the terminals where we measure / excite.
It is certainly not always the case. I went back and looked at another system: a simple 2DOF
ground===k1===m1===k2===m2<===Force
The cross transfer function velocity @ M1 / Force @ M2 still has two resonant frequencies (no reduction in "equivalent" dof).

Why did the number of resonant frequencies decrease from 3 to 2 for the cross-transfer functions (and 2nd mode self transfer function) in Figure 2 of the link, repeated here:

=====================================
Eng-tips forums: The best place on the web for engineering discussions.
 
There are 3 positions where we can apply force or measure response. The 2nd position corresponds to the 2nd row or 2nd column. The 3 positions of course don't have a 1:1 correspondence with the 3 modes.

The question was: Why did the 2nd mode peaks disappear in the 2nd row and 2nd column of figure 2?

I think I know the answer. All resonances should be reflected unless we are exciting at or monitoring at a node of the resonance.

The 2nd position happens must be a node of the 2nd mode. Therefore if we excite at 2nd position (2nd row) or monitor at 2nd position (2nd column) we won't see any contribution from the 2nd mode.

This is just a characteristic of this particular system which added a little confusion (for me at least).

It has nothing to do with the 360 change in phase, which is still a plotting artifact.

=====================================
Eng-tips forums: The best place on the web for engineering discussions.
 
The author has probably used a really bad example 3 dof lumped parameter system. Something symmetrical like

Ground-Spring1-Mass1-spring12-Mass2-Spring23-Mass3-Spring3-Ground

Where M1 = M2 and S12 = S23 and S1 = S3

This system would have a mode in which Mass 2 was stationary. That mode could never be excited or observed at mass 2

The 3 modes would be something like +++, +0-, +-+.

M

--
Dr Michael F Platten
 
Good point. I think you are exactly right (with the typographical correction that M1=M3). Everything symmetrical about m2 creates a mode with a node at m2.

=====================================
Eng-tips forums: The best place on the web for engineering discussions.
 
Status
Not open for further replies.
Back
Top