Continue to Site

Eng-Tips is the largest engineering community on the Internet

Intelligent Work Forums for Engineering Professionals

  • Congratulations KootK on being selected by the Eng-Tips community for having the most helpful posts in the forums last week. Way to Go!

Kicking the Climate Change Cat Further Down the Road... 43

Status
Not open for further replies.

ewh

Aerospace
Mar 28, 2003
6,132
What is the reputation of the NIPCC (Nongovernmental International Panel on Climate Change, a organization of 50 "top" scientists) in the engineering community? I really don't know how reliable they are, but a study (Climate Change Reconsidered II) produced by them and published by the Heartland Institute (an organization which espouses other ideas I disagree with) claims to be "double peer reviewed" and presents a seemingly well-founded arguement that AGW is a political red herring.
I am not a climate scientist, but thought that this was a good example of one side of the differing dogmas surrounding the issue. Just how is a layman supposed to make sense of these opposing arguments?
or the summary [ponder]

“Know the rules well, so you can break them effectively.”
-Dalai Lama XIV
 
Replies continue below

Recommended for you

Meanwhile "AUSTRALIA’S peak body of earth scientists has declared itself unable to publish a position statement on climate change due to the deep divisions within its membership on the issue.

After more than five years of debate and two false starts, Geological Society of Australia president Laurie Hutton said a statement on climate change was too difficult to achieve.

Mr Hutton said the issue “had the potential to be too divisive and would not serve the best interests of the society as a whole.”

The backdown, published in the GSA quarterly newsletter, is the culmination of two rejected position statements and years of furious correspondence among members. Some members believe the failure to make a strong statement on climate change is an embarrassment that puts Australian earth scientists at odds with their international peers.

It undermines the often cited stance that there is near unanimity among climate scientists on the issue."


Cheers

Greg Locock


New here? Try reading these, they might help FAQ731-376
 
GregLocock,

Thanks for the clarification. I understand your intentions much more clearly but that also causes my skepticism of your methods to be much clearer. Why would you use HadCET data to study the effect of ENSO? Although ENSO does have a global impact, the regional impact is likely least noticeable in the North Atlantic. Furthermore, while HadCET does indeed track other paleotemperature data sets well, that does not validate the aptness of selecting it for this purpose; it merely invalidates your issue with the other data sets or puts you in a contradictory position if you continue to slag other data sets while promoting CET. The year-to-year variability in CET makes it a very poor choice versus a global data set. The regional noise, which again is very distant from where ENSO events develop, is likely to obfuscate the global trend imposed by ENSO. No better example than 2010 which was a strong El Nino year and was the hottest year on every major modern temperature data set. While, in HadCET, 2010 was anomalously cold (see the drastic drop near the end of the graph).

I would encourage you to use a global temperature data set to ensure your analysis is not skewed by the regional variability in CET. However, it is merely a recommendation and, regardless of the data set, I look forward to your results.
 
Since I am not concerned with annual variation HADCET's aqnnual variabiality doesn't worry me, signal processing which is based on real maths not statistics is quite capable of getting me a multidecadal cycle correlation. I can of course apply the same method to other temperature reconstructions, and I probably will.

However given that the ENSO record is itself a reconstruction, and shares much the same data sources, that seems rather less useful as a check.


Cheers

Greg Locock


New here? Try reading these, they might help FAQ731-376
 
2) almost all of my criticisms of the litany of unrelated and unsupported arguments you’ve present remain open, without defense by you. I’d encourage you to defend previous arguments before opening new ones.
3) the demand that I address your posts presents a frustrating double standard. It’s a game that I will no longer take part in.

Clearly you're not familiar with the rules of Policy Debate, which state that the affirmative team must defend both their case ("yes there is a problem") and plan ("..and we must do ___ to fix it") whereas the negative team must only show that either there is no problem, or that the problem is not the level the Aff team claims, or that the plan won't fix it, or that the disadvantages of the plan outweigh the advantages. The burden of proof is on you. Sorry you don't like that, but you're the one that's advocating these ridiculous policies.

Here's some reading material:


The burden of proof is on the guy who wants to implement the policy.

You’ve failed to address those that I do advocate for, such as revenue-neutral carbon taxes that have had success in BC.

Oh, I addressed them quite well with the last link. According to the MAGICC model, developed by the National Center for Atmospheric Research under funding by the U.S. Environmental Protection Agency, and presuming a mean climate sensitivity of 3 degrees C (which is generous given the current IPCC literature), the USA could eliminate 100% of carbon emissions tomorrow and only produce a 0.052 degree drop in the 2050 global mean temperature. (0.137 degree drop in the 2100 temperature)

Even if you buy the science, the policy is nonsense.

Hydrology, Drainage Analysis, Flood Studies, and Complex Stormwater Litigation for Atlanta and the South East -
 
Unrelated: good luck with your soccer stuff. I just started playing again last year for the first time since the Clinton administration. It's been a real kick in my aging ass, but I've really enjoyed the opportunity and incentive to get in shape.

Hydrology, Drainage Analysis, Flood Studies, and Complex Stormwater Litigation for Atlanta and the South East -
 
Greg, fair enough. Good luck with the analysis and I look forward to the results.

Beej, and some reading material for you. While I agree that the burden of proof lies with those purporting the theory, they (and I) are not responsible for addressing the clown car of unrelated, unsupported, undefended or indefensible arguments. The circus of arguments is purely designed to prevent an actual debate from being had by continually derailing the conversation and sending it down another path. The tactic works quite well because the topic is changed so frequently that nothing can be discussed long enough to be concluded. This leaves the seed of doubt which is all “skeptics” need to continue to be “skeptical”.

The CATO calculator, quite like the institution as a whole, is carefully-crafted trash. It’s rather obvious to anyone remotely skeptical. Look at the “fine print” section. Look at the emission scenario used as the “base line”. Compare that to actual emission trends. Reflect on the consequences of selecting that scenario, specifically it’s aptness as a baseline in this comparison. Understand what assumptions that scenario makes regarding emission growth (or lack thereof) in developing nations like China and India, who according to you will never willingly reduce their emissions. Reflect on whether these assumptions are consistent with your view.

I really try to think that institutions like CATO are, due to cognitive dissonance, merely innocently ignorant and not nefariously aware of their purposeful obfuscation and sophism (or flat out lies). However, whether it’s GWPF writing an article derived from a fabricated quote, NIPCC purposefully splicing a line from an abstract to trick readers into a conclusion not supported by nor remotely consistent with the paper itself or CATO selecting a “base line” that already includes significant emission reductions to compare against emission reductions, I have a hard time believing that it’s true. There are very smart people at these institutions and I struggle to continue to delude myself into thinking the continuous flow of nonsense that excretes out of these places are nothing but honest and innocent mistakes.
 
rconnor said:
Look at the emission scenario used as the “base line”. Compare that to actual emission trends. Reflect on the consequences of selecting that scenario, specifically it’s aptness as a baseline in this comparison.

Okay.

cato said:
The baseline emissions scenario against which all climate dioxide reductions were measured is scenario A1B from the IPCC’s Special Report on Emissions Scenarios (SRES). Scenario A1B is a middle-of-the-road emissions pathway which assumes rapid carbon dioxide emissions growth during the first half of the 21st century and a slow CO2 emissions decline thereafter.

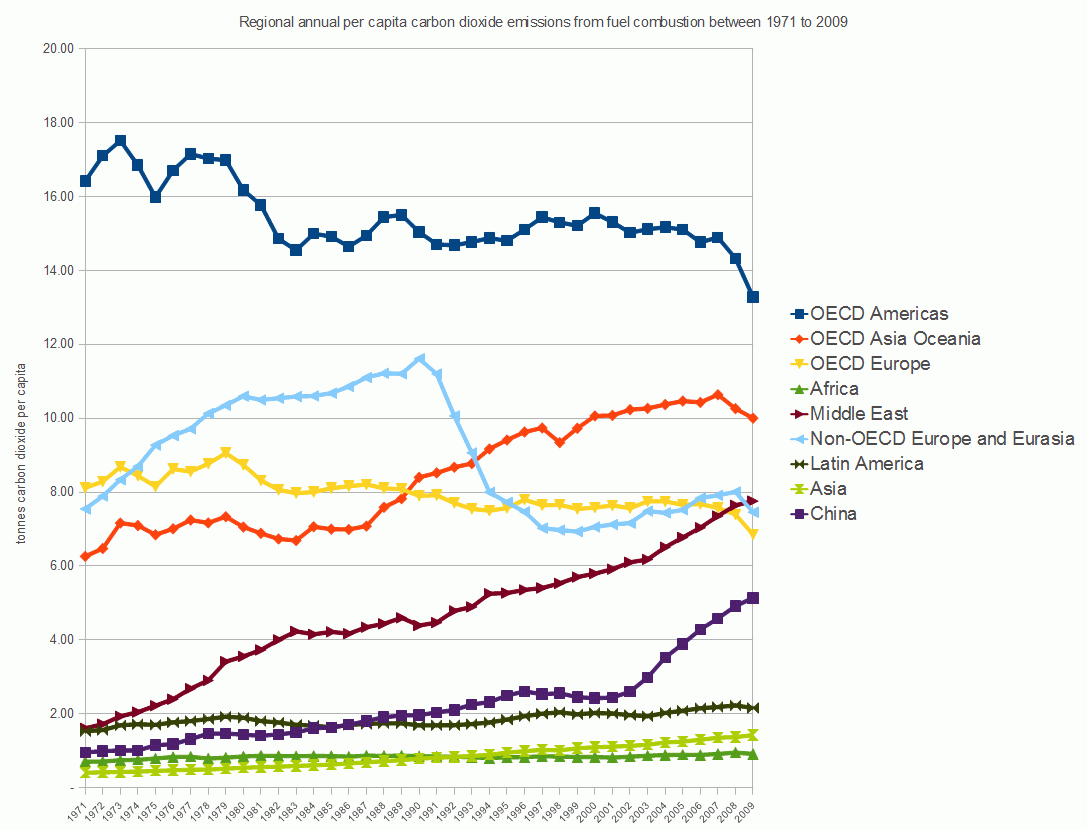
That matches the combination of carbon-per-capita trends already referenced above, and population trends projected for the areas listed. I refer you to this graph again:

Regional_trends_in_annual_per_capita_carbon_dioxide_emissions_from_fuel_combustion_between_1971_and_2009.png


..which shows CO2 per capita already declining everywhere but the Middle East and China, and this graph:

20110503_POPULATION_graphic-popup-v3.jpg


..which shows the generally accepted downward bend in population, particularly in those areas with high rates of CO2/cap increase now, that starts to occur midway through the next century.

Based on that data, the A1B scenario is the obvious and clearly responsible choice to compare against.

Hydrology, Drainage Analysis, Flood Studies, and Complex Stormwater Litigation for Atlanta and the South East -
 
(Thanks beej, I appreciate it. It was a very positive experience for my players and I’m pleased with their performance on the field. I love the game, it’s always been a huge part of my life and I’m really enjoying the transition into coaching. Good to hear you’re getting back into it! Enjoy!)
 
If you're ever in Atlanta, let me buy you a beer. Just to make sure we both understand that this particular disagreement is and always should be civil, especially among professionals. :)

Hydrology, Drainage Analysis, Flood Studies, and Complex Stormwater Litigation for Atlanta and the South East -
 
Beej67,

It’s important to realize that scenario A1B is not the “business-as-usual” option. The reference to the CO2 per capita is misleading. While Europe and the US have made some efforts to reduce consumption, global emissions continue to rise. A1B involves significant changes that reduce growth in global emissions to the point they peak in 2050 and then begin to decline. A strong balance between renewable and fossil fuels is found globally. It also assumes a much more global community where countries are actively working, including China, India and Russia. Are you saying that without any form of climate policy, CO2 emissions will not just slow down but begin to reduce in 2050, such that 2100 emissions will be close to current levels? I find that rather hard to believe as not too long ago you were saying that it will be rather impossible to get China, India and Russia to reduce their emissions, so we may as well not bother. Now are you saying that because China, India, Russia and the rest of the globe will reduce their emissions voluntarily, so we may as well not bother? I trust that’s not the case and, therefore, I trust that you actually don’t agree with A1B being the “business-as-usual” baseline.

It is incredibly misleading for CATO to use A1B as a base line. It really makes no sense whatsoever; CATO is comparing the additional effect of further localized reductions on top of significant global reductions. Of course the difference will appear to be insignificant. It’s like predicting weight gain of a person in 10 years who eats nothing but McDonalds by comparing a carb and fat free diet against a baseline diet of significantly reduced carb and fat intake and then because the difference is negligible concluding that the person should continue with their McDonalds-only diet.

The % reduction in the calculator is based on reductions from a 2005 baseline occurring by 2050. How quickly the reduction takes place, is unknown, however, the full reduction is not realized until 2050 so to compare 2050 temperatures is misleading. So let’s use 2100 as the comparison. However, even this has its problems as A1B global emissions reduce from 2050 to 2100 whereas the CATO calculator holds emissions at the 2050 level. The more you look into this, the sketchier to becomes.

The closest thing to a business-as-usual scenario, and most appropriate “base line”, is A2 or A1FI. Well-known skeptic Richard Tol even agrees that A2 is the most realistic base line future scenario, so let’s go with that. From AR4 WG1 SPM, the best estimate temperature change in 2090-2099 for A1B is 2.8 deg C (1.7 to 4.4 deg C) and for A2 is 3.4 deg C (2.0 to 5.4 deg C). This shows that there is a significant difference depending on the which baseline you select and that difference only gets bigger after 2100.

Beyond the issue with the base line (which to me is a major issue), there is still the question of how the difference is calculated. Yes, they used MAGICC to calculate but there is still plenty of opportunity to twist the values around but they provide very few details. Given the obvious bias in the baseline selection and the history of misinformation from CATO, I’m very skeptical that the analysis was done while trying to minimize any biases.

And beej, only if I can get the second round! I feel we are both conservationalists with much in common, I’d just like to convince you that CO2 emission reduction is also a very important part of conservation haha! You are absolutely right and I do need to acknowledge that my tone can go from strident to downright disrespectful at times (although it’s rather give-and-take). If I am pushing for a more rational discussion, it starts with me engaging with a tone more conducive to a positive dialogue.
 
Scenario A1B is a middle-of-the-road emissions pathway which assumes rapid carbon dioxide emissions growth during the first half of the 21st century and a slow CO2 emissions decline thereafter.
It also assumes a much more global community where countries are actively working, including China, India and Russia.
Sounds like a whole lot of assuming going on.

Good Luck
--------------
As a circle of light increases so does the circumference of darkness around it. - Albert Einstein
 
I sent some dialog about the case issue to Cato, they seemed like they'd be interested in updating the model. We'll see.

In the mean time, I stumbled across a graph that cuts to the quick of the actual problem, which isn't carbon, and it isn't warming. It's mankind's proliferation and our incessant need to terraform the environment to suit our comfort.

extinctionandpopulation_1026091.jpg


Hydrology, Drainage Analysis, Flood Studies, and Complex Stormwater Litigation for Atlanta and the South East -
 
You can only extinctify the species you know about. So since we are discovering new species all the time, it follows we have a greater number of extinctions. I'm not saying that graph is wrong, but it needs a more rigorous approach. I have a horrible feeling Bayesian statistics are involved. Also if the human population started to fall that extinction curve would continue to rise.

Cheers

Greg Locock


New here? Try reading these, they might help FAQ731-376
 
Beej67, one of the issues that I have with extinction "numbers" is that they are generally based on numerical simulations and not an actual "body count". Considering how many species are estimated to exist vs how many we know of, I'd like to know the taxonomy (genus and species) of the ~55,000 species extinct (is that cumulative or annual extinctions?). In the last couple of hundred years, there were certainly extinctions, but the total number is more in the <100 quantity.

Not that maintaining wild spaces isn't a noble cause. But, please, a little critical thinking about this...
 
To put it more bluntly, if you have no idea how many species there are or or how many there have been in the past how the hell do you think you can you estimate a rate of extinction, or more importantly the rate of change of the rate of extinction? A New York Times Science article says 8.7 million, but 150,000 "new" species are discovered every year (over and above the 50,000 that the graph above claims die off). [Don't like the New York Times as a source? Neither do I. That article is just the first entry in a 146 million entry list in response to the question "how many species are there". Pick your own sources] Do you really think that any of them are really "new"? Just new to us is more likely. Once again, it is our utter arrogance that makes us think that: (1) mankind is the source of all the planet's ills; and (2) mankind can fix anything that is "messed up" (e.g., someone finds that a useful and vital chemical like Chlorine or CO2 is somehow "harmful" then we can rally round and ban them; or we can get together and stop the evil horned owl from eating the eggs of the spotted owl in an almost human-like genocide that the Greenies are trying to "fix").

I firmly believe that the increase in the rate of extinction around the end of WWII in the graph above is a LOT more about an increase in the time available (due to the existence of cheep energy) to study useless factoids than it is about an actual increase in the rate of extinctions. More people looking equates to finding more stuff. If that many people had been looking in 1814 (with the tools they use today), I would bet long odds that the rate of extinctions would be very similar to today's number--and the tools we will employ in this uselessness in 2050 will give us a much higher rate of extinctions even if half the human population dies in a pandemic (likely caused by the snail darter).

David Simpson, PE
MuleShoe Engineering

Law is the common force organized to act as an obstacle of injustice Frédéric Bastiat
 
Also if the human population started to fall that extinction curve would continue to rise.

I don't think so. I think if the human population started to fall, we would probably cease encroaching into habitat. Heck, there's areas of Detroit that are turning back to wilderness. The primary sources of pressure we place on the environment are toxic pollution, habitat loss, and vectors for disease and invasive species.

Beej67, one of the issues that I have with extinction "numbers" is that they are generally based on numerical simulations and not an actual "body count".

What, you mean like earth temperature prior to 1900? :)

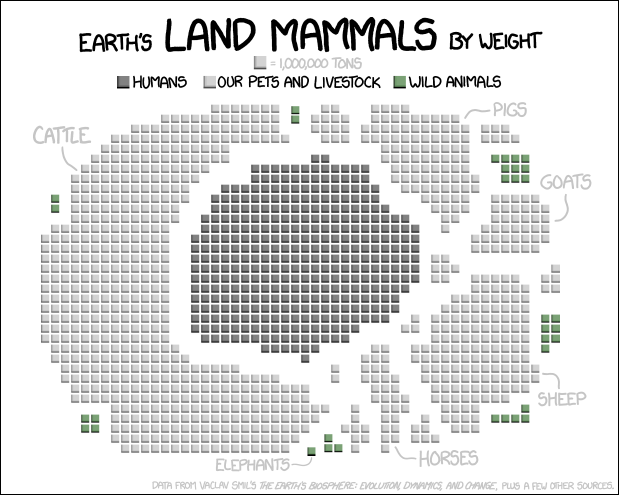
I've posted that XKCD image before. It's integrally linked to this:

Mitchelletal2011Fig1.png


Familiar looking hockey stick, there. Over 20 years, a pound of methane will warm the planet 86 times more than a pound of CO2, purely scientifically speaking.


Hydrology, Drainage Analysis, Flood Studies, and Complex Stormwater Litigation for Atlanta and the South East -
 
I would expect the count of organisms to increase, but not necessarily the biodiversity. Those wild areas of Detroit a populated mostly by feral housecats, packs of dogs, rats, and cockroaches.

Someday you need to take a spin through sub-Saharan Africa, the Amazon Rain Forest, the Outback, Alaska, Siberia, Mongolia, and almost any tropical island in the Pacific. The 3-4% of the earth dedicated to "wild animals" in your cartoon is a tiny bit misrepresented. There are wild moose in downtown Anchorage--not because of habitat loss, but because they enjoy the tasty landscape plants more than their traditional food. Wild caribou herds cluster around the Alaska pipeline because it gives off a bit of heat that reduces their energy requirements slightly (the enviro-wackos claimed that the pipeline would cause these herds to lay down and die out of frustration at this new element in their world, the caribou are thriving, sadly so are the enviro-wackos).

When I look at wild habitat in Alaska (mostly not managed by man in any way) compared to someplace like Yellowstone that has been intensely (mis)managed for over a century I am in awe at nature's ability to adapt to change. A fire starts in Denali National Park, it eventually burns itself out and a couple of seasons later you can't tell it ever happened except that weak and marginal species are not there anymore and the remaining flora is healthier. A fire starts in Yellowstone and they call out the National Guard and every fire squad in the country. The result is catastrophic to the ecology. Marginal and invasive species are pushing out the stuff that was there when the park was formed. We eliminate predators and the deer, elk, moose overgraze the river banks and erosion turns the mountain streams into mud holes.

People are part of nature. Our artifacts are just as "natural" as a beaver dam or a termite mound. Insects put far more "Greenhouse Gases" into the atmosphere than people do. The biomass of bacteria (whose waste decays rapidly to methane and CO2) exceeds the biomass of all plants and animals (I got that from Wikipedia just now, if you don't like Wiki, look for yourself, they are citing peer-reviewed journals). The mass of termites exceeds the mass of humans (and we all know about the methane and CO2 coming off termite mounds). The mass of ants is about equal to humans. Krill is the most populous animated being on earth. People plus domestic animals plus crops represent a biomass around 3 billion tonnes out of a total number just under 600 billion tonnes (call it 0.5%)--the other 99.5% can and will take care of itself quite well thank you.

David Simpson, PE
MuleShoe Engineering

Law is the common force organized to act as an obstacle of injustice Frédéric Bastiat
 
What if burning natural gas, not only produced CO2, but also produced H2O? Would the additional H2O rase the ocean levels? So just how much H2O has been created this way?
 
With tongue in cheek, it's obvious that cattle, pigs, goats, and sheep are the real problem. Perhaps we need more fish and poultry in our diets. [cow]

It is better to have enough ideas for some of them to be wrong, than to be always right by having no ideas at all.
 
Status
Not open for further replies.

Part and Inventory Search

Sponsor