Eng-Tips is the largest engineering community on the Internet

Intelligent Work Forums for Engineering Professionals

RSS Tolerance Questions! 2

Gavin_yang

Mechanical
Oct 23, 2024
4
0
0
JP
Hi everyone, I'm trying to learn RSS in tolerance analysis these days and I just have some question, pls give me some help thx.

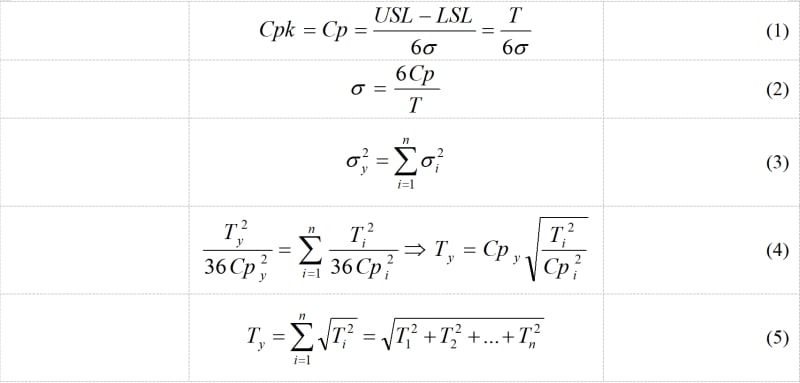
In RSS, we need to set a Cpk values for all parts (most common = 1.33)

I just want to know are there any assumptions or requirements that the Cpk of each parts need to be the same

Because the process capability of diffierent factories may not be the same, like Cpk(factory A)=1.33, Cpk(factory B)=1.0, Cpk(factory C)=1.33 ... something like this

So when performing tolerance analysis, could I just use diffierent Cpks for each parts in calculating ?

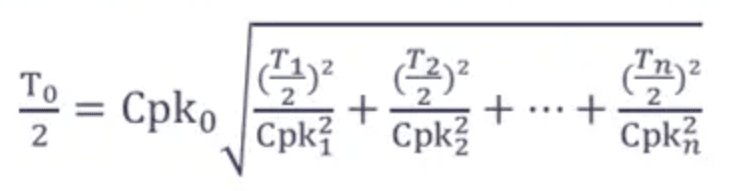
Dimension A → 5±0.5 Cpk=1.33
Dimension B → 2±0.3 Cpk=1.0
Dimension C → 4±0.5 Cpk=1.33

Goal X → X=A+B-C 3±T Cpk=1.33
 
Replies continue below

Recommended for you

%E5%BE%AE%E4%BF%A1%E5%9B%BE%E7%89%87_20241023222416_egyyms.png


Also, I have a equation here which I find on the internet

T0 and Ti means (USL-LSL)

That's what I mean calculating the tolerance of goal dimension X with using diffierent Cpk on each parts

Is that right?
 
Hi Gavin,

By "RSS tolerance analysis", I am assuming you mean Root-Sum-Squares calculations applied to tolerance stack-ups to achieve a 'statistical' result as opposed to an absolute arithmetic result. The RSS calculation is applied to the tolerances/variations of the individual factors in the stack-up to get a more realistic total range of variation based on statistical principles.

So, short answers to your 2 questions: #1: No, #2: Yes

As a first step to answering your question thoroughly, you have to make sure you understand the difference between your nominal and mean for each factor, and the difference between the tolerance and standard deviation for each factor, and choose which way to do the stack-up.

In it's most basic form, the stack-ups are done with the drawing nominals and tolerances, so the standard deviation is assumed to be the same percentage of tolerance for each factor. We always assumed that the tolerance range (USL-LSL) = 6 standard deviations, but that is not necessarily 'Gospel". If you want to do the drawing-based analysis with different Cp (k omitted on purpose) assumptions for each factor, then you would do it by scaling the drawing tolerance up or down appropriately.

If you instead want to calculate the stack-up with actual data that you have measured, then you can use the actual mean (this gives the difference between Cp and Cpk) and the actual standard deviation (multiplied by A, where A = 3 for the +/- tolerance value @ Cp = 1.0).

Some additional notes from my experience:
- Don't use statistical stack-ups with fewer than 4 sources of variation. A minimum of 6 is even better.
- Don't use statistical stack-ups when the sources of variation are significantly different in magnitude (10x or more?). When they are significantly different, I recommend a combined stack-up where the large variation(s) are treated arithmetically, and the smaller ones are treated by RSS.


Best regards,
Doug Hunter
Altarium Technical Consulting
 
It looks like we were writing at the same time. I think the math would work out the same between your equation and the method that I described. I'll let you derive/check it. One important point, again, is that it's better to use Cp with the drawing nominal instead of Cpk, unless your process is 100% mean-centered. Cp is a measure of variation only, while Cpk considers the mean-centering, which should not go into a variation calculation theoretically.

Best regards,
Doug Hunter
Altarium Technical Consulting
 
Thanks Doung, it really helps a lot.

I'm trying to figure it out the meanings and calculating methods of each parameters that appears in Tolerance analysis (especially RSS, Root-Sum-Squares). For simplified, I make an assumation that "100% mean-centered",so I think it goes to be "Cp = Cpk" whcih leads to the equation (1) and (2).

According to the Normal Distribution, the standard deviation of target (name it sigma_y) and stack-ups (sigma_i) follow equ(3) .

Then, substitude equ(2) into equ(3), we get equ(4). For the situation like you said above, Cp=1, we get equ(5) which is the most common method to calculate "+/- tolerance values" in RSS tolerance analysis (most information I found on website follows this equation).

When trying to give diffierent values of Cp for stack-ups, equ(4) should be used to calculate tolerance values. For example Cp_1=1.33, Cp_2=1, Cp_3=1, Cp_4=1.33... . Obviously, after giving a specific value of Cp_y (such as, Cp_y=1.33), the target tolerance T_y is obtained. For sure, in the case where Cp_i and T_i remain unchanged, T_y goes changed by Cp_y. Bigger Cp_y leads to bigger T_y. I think this should be right[shriner].

%E5%BE%AE%E4%BF%A1%E6%88%AA%E5%9B%BE_20241024004615_tv7t1z.jpg


Gavin_yang
 
Back
Top