Pretty Girl
Structural
- Nov 22, 2022
- 148
I created this chart and the members of this forum made a great contribution towards it.
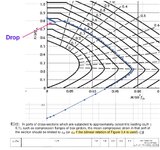
My chart aligns well until the pure compression, with the standard chart mentioned at "How to Design ConcreteStructures using Eurocode 2".
The problem is, it doesn't align when it enters the pure compression.
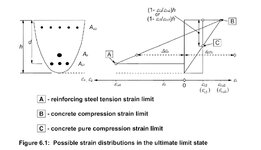
The eurocode says in clause 6.1 (5) to apply 0.00175 strain when in pure compression. So, I monitored when the column is in pure compression (that means whole section is in compression) and from that point onwards I applied a 0.00175 cap of strain for steel.
The member @IDS mentioned it cannot have a dip like in my chart and it should be smooth transition.
However, as I see, although the NA reaches the bottom bars which they will be near to zero strain, the top bars are still near the 0.0035 strain (depends on the distance). So the total axial load (N) in the mid range (before pure compression) will always be more than the strain capped pure compression range (with 0.00175 capped).
Since we apply the 0.00175 cap after the column enters pure compression, there must be a dip/drop etc. But some members says there can't be.
I don't get how the two strains can meet at the same place when transitioning to two different strains.
Further, if a different calculation is used to forcefully make the mid-range line meet the pure compression line, that mid-range line should lie lower than the standard chart's lines, and they can't travel at the same path the standard charts have.
Any insights on this, if my dip is correct or not?
Further, I don't want smooth lines, I just want to be accurate and Eurocode compliant and follow their method.
The column parameters: 500 * 250 mm, fck = 40, fcd = 22.6 kn/mm2, cover (from r/f centre to top surface and right side surface) = 57 mm, r/f diameter = 36 mm, steel fyk = 500 n/mm2, steel fyd = 434.78, E = 200000, yield strain of steel = 0.00217, number of bars 4, one in each corner, d2/h = 0.15.

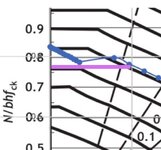
Or should I just cut it like the following?


My chart aligns well until the pure compression, with the standard chart mentioned at "How to Design ConcreteStructures using Eurocode 2".
The problem is, it doesn't align when it enters the pure compression.
The eurocode says in clause 6.1 (5) to apply 0.00175 strain when in pure compression. So, I monitored when the column is in pure compression (that means whole section is in compression) and from that point onwards I applied a 0.00175 cap of strain for steel.
The member @IDS mentioned it cannot have a dip like in my chart and it should be smooth transition.
However, as I see, although the NA reaches the bottom bars which they will be near to zero strain, the top bars are still near the 0.0035 strain (depends on the distance). So the total axial load (N) in the mid range (before pure compression) will always be more than the strain capped pure compression range (with 0.00175 capped).
Since we apply the 0.00175 cap after the column enters pure compression, there must be a dip/drop etc. But some members says there can't be.
I don't get how the two strains can meet at the same place when transitioning to two different strains.
Further, if a different calculation is used to forcefully make the mid-range line meet the pure compression line, that mid-range line should lie lower than the standard chart's lines, and they can't travel at the same path the standard charts have.
Any insights on this, if my dip is correct or not?
Further, I don't want smooth lines, I just want to be accurate and Eurocode compliant and follow their method.
The column parameters: 500 * 250 mm, fck = 40, fcd = 22.6 kn/mm2, cover (from r/f centre to top surface and right side surface) = 57 mm, r/f diameter = 36 mm, steel fyk = 500 n/mm2, steel fyd = 434.78, E = 200000, yield strain of steel = 0.00217, number of bars 4, one in each corner, d2/h = 0.15.

Or should I just cut it like the following?


Last edited:
