Continue to Site

Eng-Tips is the largest engineering community on the Internet

Intelligent Work Forums for Engineering Professionals

  • Congratulations KootK on being selected by the Eng-Tips community for having the most helpful posts in the forums last week. Way to Go!

Use SRS input for Nastran SOL 111

Mech.ing.mg

Mechanical
Dec 20, 2024
2
hello everybody. It’s my first time here, so I introduce myself. I’m Mat, Mech engineer, and I work as stress analyst. I’m used to employ SOL111 for random response analysis. PSD input -> SOL111 -> PSD output. Quite straightforward. When dealing with shock input, given SRS profile, I usually calculate an “associated” acceleration time profile (that has a SRS covering the given SRS) and then I perform a transient analysis (SOL112) to calculate stress output and assess structural integrity. I was wondering (and I’ll really be grateful for your help) if it could be possible to use the given SRS as input for a SOL111 to generate stress output. Is it legit? How Nastran understands that the input is not a PSD? And finally, how the calculated stress results should be considered to assess structural integrity?
Many thanks for your help
Mat
 
Replies continue below

Recommended for you

Dear Mat,
Random Vibration analysis is a postprocessing task of modal dynamic frequency response (SOL111), see my blog of Simcenter FEMAP & NASTRAN:
The excitation for a frequency response (SOL111) in general is a constante acceleration in the frequency range, either a force loading or a base motion, see my blog:

If you have a sock event excitation of Response Spectrum Acceleration vs Frequency you need to run a Response Spectrum Application analysis (see my web: http://desarrollo.iberisa.com/soporte/femap/dinamico/response_spectrum_4story.htm): you will get the max response of the structure, is only one value, is a way to perform a trasient analysis for us poor engineers.

If you have a seismic excitation of acceleration in the time domain you can perform a Response Spectrum Generation analysis: the NASTRAN solver will generate the acceleration vs frequency (output spectra) at the location specified using different damping values. This spectrum will be used as the excitation of a Response Spectrum Application analysis of the component located at that point to obtain the peak reponse of displacements and vonMises stress. This type of analysis is also referred to as Shock Response Spectrum (SRS) Analysis.

The THEORY says the following:
Response Spectrum Analysis is an approximate method used to predict the peak response of some component to a transient excitation at the base of the structure, for instance, a sesismic excitation. The primary assumption made for this analysis process is that the peak response of the component is calculated without regard to the exact time it is occurring.

Response Spectrum Generation analysis in general, is actually a two-step analysis process. The first step is to perform a transient dynamic analysis of some relatively coarse representation of a base structure. Parameters are added to the analysis which cause Simcenter Nastran to create and output an acceleration response spectrum at selected locations on the structure. Typically these are locations where some detailed model of interest is attached.

The second step of applying the spectrum to the detailed model is performed by using a specialized solution based on a normal modes analysis. This technique calculates the peak response by scaling the modal responses by the input spectrum and then summing the modal responses using one of the available summation techniques. It is a useful and economical tool in determining the maximum response of a structure without regard to the exact time it is occurring.


I love to run Modal Transient Dynamic analysis (SOL112) to deal with shock loading analysis, see my blog, but the cost is important, then when available I preferer to work in the frequency domain, is cheaper!.

Best regards,
Blas.
 
Hi Blas, thanks for your response.
I’ve looked at you blog, really comprehensive. My problem is than I use Patran/Nastran for my simulations (mostly editing the .bdf to run the analysis) and I couldn’t recognize the figures you used to explain the different steps your explanation.
I’ll try to keep it simple, just to let me understand better your point of you (and maybe clear my doubts).
Let’s say that I run a SOL111 using an input acceleration of 1, constant, in a frequency range between 1 and 500 Hz (the model units are kg,m,s), asking as output the acceleration (sort1,plot,phase) in a given node.
Is this output the transfer function (let’s call it H) between the input node and the output node or the square of the transfer function (H^2)?
Many thanks and best regards
Mat
 
Dear Mat,
In the blog I explain a simply cantilever beam of a sine vibration modal frequency response dynamic analysis (SOL111) under a base motion:
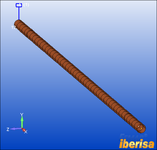
1734960057427.png

The constrained node of the base is excited by a constant acceleration of 0.25G in the frequency range say 0-500 Hz:
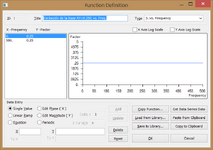
1734960131554.png
Critical damping of 10% is defined to be constant in the frequency range.
Modal/eigenvalue analysis (SOL103) is performed, showing the modal mass participation factor and the values of natural frequency and mode shapes: extracting 30 modes capture more than 90% of the modal mass in the three directions, then we are sure of the accuracy of the dynamic response when using the modal method.
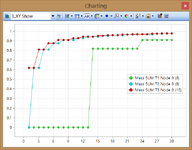
1734960409890.png

And finally the modal frequency response dynamic analysis (SOL111) is performed.
The following X-Y plot compares the peak response at the beam tip vs. the input acceleration prescribed at the base (blue curve): please note that an excitation of 0.25G's is applied and a maximum response of almost 4 G's is generated, which represents a dynamic amplification factor DAF = 4/0.25 = 16 times, impressing!!.
The peak responses in the frequency domain all are exactly coincident with the natural resonant frequencies included in the frequency range between 0-500 Hz, for this reason is important to run previously the model/eigenvalue analysis (SOL103) and generate automatically the modal frequency table list based in the modes, this is done very well by the FEMAP pre&postprocessor.
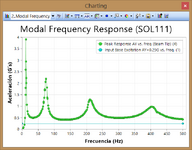
1734962349554.png

The above graph is the response of acceleration vs. frequency at the tip node of cantilever beam in the global Y axis direction, that is coincident with the direction of the excitation.
Best regards,
Blas.

PD
The peak response at 0.0 Hz is exactly coincident with the result obtained by a linear static analysis (SOL101), then you can imagine, depending the problem a linear static analysis could be useless if the structure is very flexible: in this case I see the 1st natural frequency of the beam vibrates at 12 Hz ==> this is a frequency value very low, it means the structure is very flexible, then the chance to suffer high dynamic amplification factors in case of applying an excitation with a frequency coincident with the fundamental frequency of the beam is there, so a linear static analysis should be useless, we need to see the full scope of the structural behavior of the beam, OK?.

Ah!!, also please note ALL IS LINEAR in modal frequency & random response, so many times we will have to solve the structural problem running a transient nonlinear dynamic analysis (SOL401, 129), this is life!!.
 

Part and Inventory Search

Sponsor