human909 - I was going to post some text from the AS 1170.4 commentary, but I see you already posted it yourself on 20th Feb.
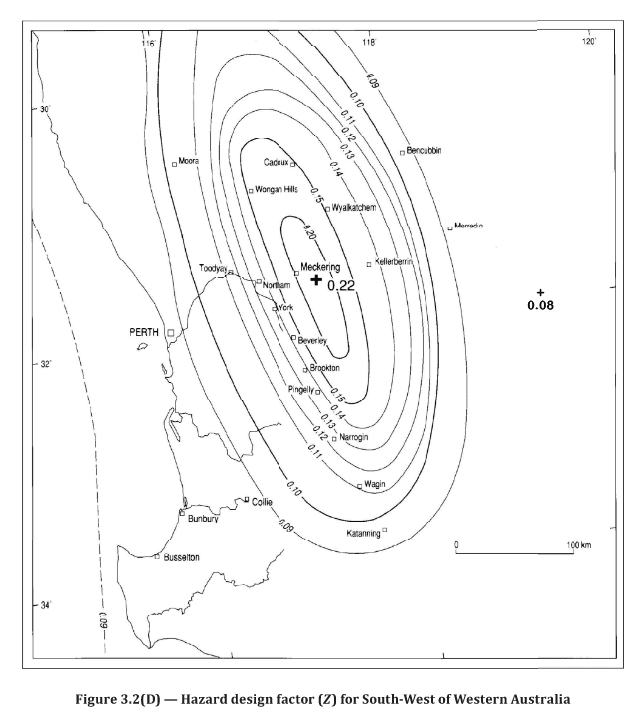
It seems to me that the commentary makes the intended application of the maps perfectly clear. It clearly states that the contours are the outer boundaries with a specified minimum Z value, and outside the Z = 0.09 contour the required value is Z = 0.08. I see no statement or implication that the Z value should be interpolated between the boundaries of the regions. The contours therefore delineate regions with a constant required Z value.