Continue to Site

Eng-Tips is the largest engineering community on the Internet

Intelligent Work Forums for Engineering Professionals

  • Congratulations KootK on being selected by the Eng-Tips community for having the most helpful posts in the forums last week. Way to Go!

AS1170.4 Draft 2

Status
Not open for further replies.

Trenno

Structural
Feb 5, 2014
831
New AS1170.4 draft is out for public comment, closing 18/01/24.

Seems like reo rates may be on the rise again with the introduction of these two proposed admendments.

11_pf8yar.png


22_qutf6k.png
 
Replies continue below

Recommended for you

Is it just me or does the 2024 standard still have the old contour maps in it anyway?
 
The contour map is the same, with the addition of the Z=0.08 points, as per some of the comments above
 
None of which makes sense because a single 0.08 point on a contour map implies everything between that 0.08 point and the 0.09 contour is ABOVE 0.08. Which in the text it indicates otherwise.

This implies that the contours are not actually true contours they are region boundaries not contours. Which implies that the local maximum point likewise have no meaning as they do not envelope a region.

Who ever is drawing the maps is doing a terrible job of translating what must be a vastly more complex and nuanced maps behind the AS 1170.4 maps.
 
human909 - I was going to post some text from the AS 1170.4 commentary, but I see you already posted it yourself on 20th Feb.

It seems to me that the commentary makes the intended application of the maps perfectly clear. It clearly states that the contours are the outer boundaries with a specified minimum Z value, and outside the Z = 0.09 contour the required value is Z = 0.08. I see no statement or implication that the Z value should be interpolated between the boundaries of the regions. The contours therefore delineate regions with a constant required Z value.

Doug Jenkins
Interactive Design Services
 
Confusion among designers because the code writers are bad writers. Syd Melb Bne shouldve always been in the table. That's half the population. And map numbers should be between lines and not on lines if IDS and commentary are right. But the commentary is unofficial and out of date now.
 
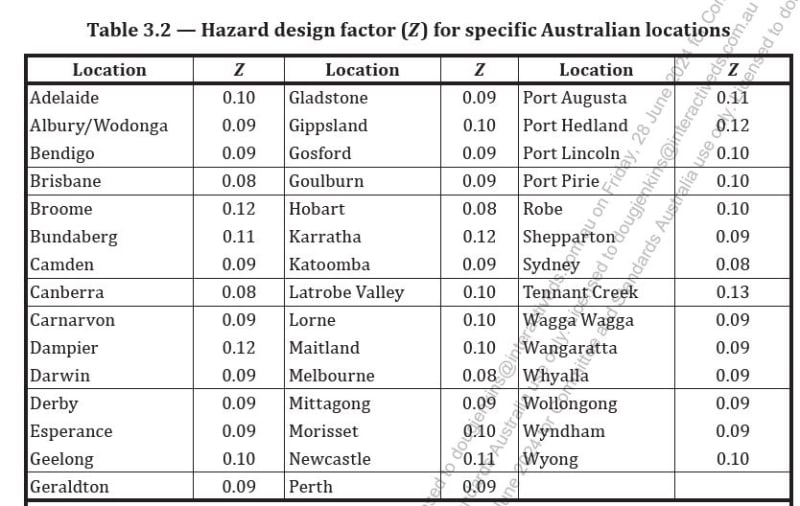
You mean this table?
Engtips7Aug24_zks8xg.jpg


As for the Commentary being unofficial and out of date, it was prepared by a committee chaired by the chair of the Standards committee and "provides background material and guidance to the requirements of the Standard". It was published in 2021, and the only change to the maps in the latest Standard is consistent with the interpretation given in the commentary, so it seems to me to be the best available statement of what was intended.


Doug Jenkins
Interactive Design Services
 
Yeah the table they fixed after the insane decision to delete half the population and cause confusion.

All commentaries are unofficial because not BCA referenced but this one isn't even standards Australia. Judges aren't engineers and would probably be confused too if something ended up in court.
 
I think the map is quite clear and the table makes it even more clear. There is no interpolation. All zones within a contour boundary have the Z value shown on the boundary, unless they are included in an inner contour with a higher Z value. That's it. Adding the 0.08 point simply says, this zone is 0.08 until you find a boundary with 0.09.
I find many other parts of this and other codes a lot more confusing to be honest

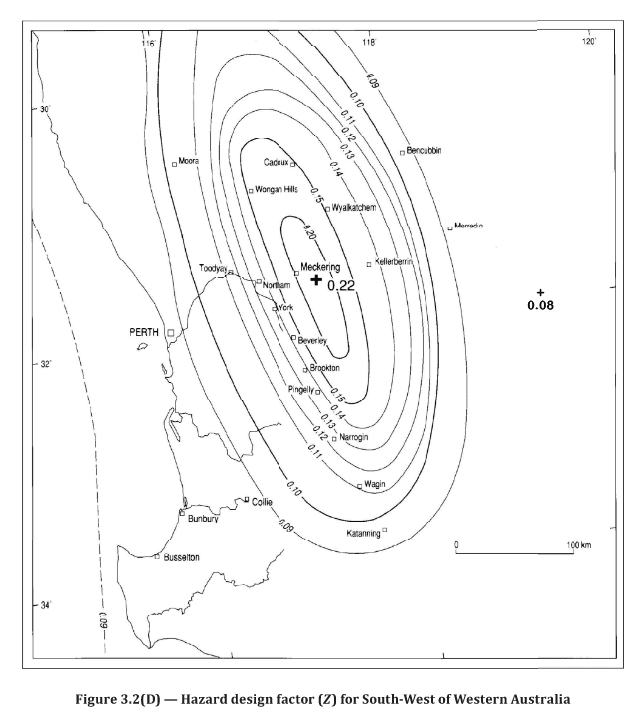
The only quite confusing thing I find is that, jusdjing from the map, Perth looks in the 0.08 zone, however the table says it's 0.09 and I see how this particular case could actually cause a general misinterpretation of the map. Not sure if there are other similar instances.

Screenshot_2024-08-07_124020_yf8esa.png
 
Perhaps Perth has been assigned 0.09 because part of the region would be across the 0.09 boundary? I do hate how this map has been drawn however, they're not really contours and are more similar to the borders of regions (think 1170.2 zones)

----------------------------------------------------------------------

Why yes, I do in fact have no idea what I'm talking about
 
Just Some Nerd said:
Perhaps Perth has been assigned 0.09 because part of the region would be across the 0.09 boundary? I do hate how this map has been drawn however, they're not really contours and are more similar to the borders of regions (think 1170.2 zones)

for sure. However the map shows that little square indicating Perth clearly outside of the 0.09 zone, which it's funny at the very least.
Also I wonder if "Perth" includes the whole metropolitan area? Could we design a structure in, say, Fremantle or Rockingham, with Z=0.08?
 
IDS said:
human909 - I was going to post some text from the AS 1170.4 commentary, but I see you already posted it yourself on 20th Feb.

It seems to me that the commentary makes the intended application of the maps perfectly clear. It clearly states that the contours are the outer boundaries with a specified minimum Z value, and outside the Z = 0.09 contour the required value is Z = 0.08. I see no statement or implication that the Z value should be interpolated between the boundaries of the regions. The contours therefore delineate regions with a constant required Z value.

But that is my point is it a graduated contour map? Or a distinct ZONE map? A contour map by definition (at least most definitions I'm aware of) is a graduated map. The 1170.4 map is drawn like a contour map but other commentary indicates it is zones not contours and to be fair I don't think any of the text says contour.

However if that is the case then why does it indicate singularity peaks both of HIGH (0.22) and low (0.08)? They are useless and misleading pieces of information, particularly the peaks which have no relevance if it is interpreted as a zone map.

JustSomeNerd said:
Perhaps Perth has been assigned 0.09 because part of the region would be across the 0.09 boundary? I do hate how this map has been drawn however, they're not really contours and are more similar to the borders of regions (think 1170.2 zones)
Excellent point. It highlights the conflicting messages very well.
 
There are other examples where the location falls outside a certain contour on the map but is overridden by a value in the table. E.g., Wangaratta is 0.09 in the table but is clearly outside the 0.09 contour. I suspect back in the past, these were intended to be true contour maps, and at some stage the decision was made to simplify it all by avoiding having to interpolate between contours (hence why we now select the lower contour). Just a guess, there might be another reason.

There are some other quirks in the maps that don't make sense. E.g., Wagga Wagga is drawn on the north side of the Murrumbidgee River, even though it is actually on the south side. Swan Hill should appear almost directly on the NSW-VIC border but there is a fair distance on the map. All this tells me it is not intended to be km accurate.
 
I'd suggest that the contour maps are what they are. Use the table where you can, otherwise go off what everyone's done on previous Projects.
There was a point in time here in Melbourne where i saw other Companies designs using Z=0.09 where 0.08 had been used since the dawn of time.
I got this as a third-party certification review query on this a few years back and it led me to Geosciences Australia's "The 2018 National Seismic Hazard Assessment for Australia", website - and document attached.

The most dramatic bit is Section 3.1. "The average percentage difference between NSHA18 seismic hazard values and the hazard factors for localities listed in T3.2 of AS1170.4 2007 is approximately 72% (reduction of the calculated hazard factors from the factors quoted in AS1170.4!).
Essentially through increased ability of Geosciences Australia calculation power / methods over the years (computer advancements etc) the hazard values (calculated ones)are much much lower than the hazard factors (quoted in AS1170.4 for us to design to - note the difference in the definitions, they mention in the assessment report that this is intentional).
For example; AS1170.4 hazard factor for Melbourne is 0.08, whereas the corresponding NSHA18 calculated value is 0.031..


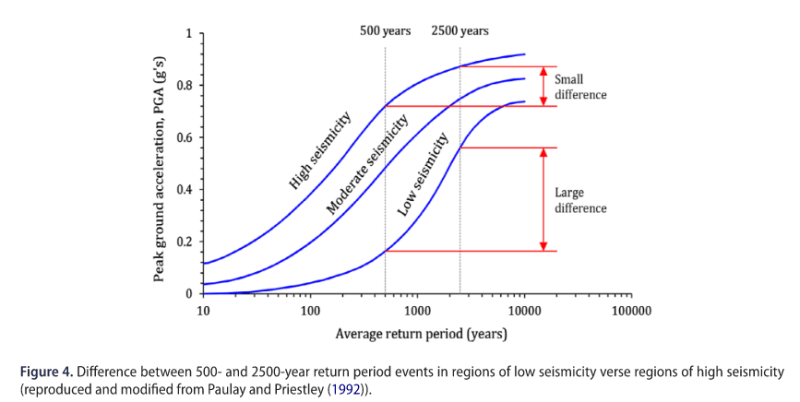
My understanding is that the logic of using such high Z values compared to the actual, newly calculated values, is the dramatic increase in acceleration on 2500y return period earthquake typical of low seismicity zones, so if we designed at 500y for the real Z value, that one time in history where a 2500y earthquake hits, it would obliterate every structure ever designed, hence the decision of keeping the old, conservative Z values.

This is a presentation which addresses this
Ref:

This is a graph that shows visually what I said above
Screenshot_2024-08-08_162820_g9ipob.png


To sum up, when we design for 500y earthquake, in reality in most cases we are not designing for 500y return period, but for a much longer one
 
Well highlighted li0ngalahad, that graph really highlights the risks well. While Australia doesn't have the big fault lines of some high risk regions, the entire continent is moving the most 'rapidly' out of any continent. Our risks are broad across the continent and still not completely known due to the low recurrence intervals and limited historical observation.

SRL V1.0 said:
whereas the corresponding NSHA18 calculated value is 0.031
That is for a 50 year return period which is ridiculously low.

Only three years ago Melbourne felt a 'decently' sized tremor. The epicentre at Mansfield 130km away has PEAK GROUND ACCELATION of 0.20g, so almost 7 times the figure above if you didn't notice the decimal shift. We had an after shock just 2 days ago.


I have heard it often quoted and there is at least one study from about 15 years ago that supports it.
"reinsurance companies rate an earthquake in Sydney within their top 20 risk exposures worldwide"
And if you start looking around you can see plenty of structures that are would be quite at risk.
 
human909 said:
That is for a 50 year return period which is ridiculously low.

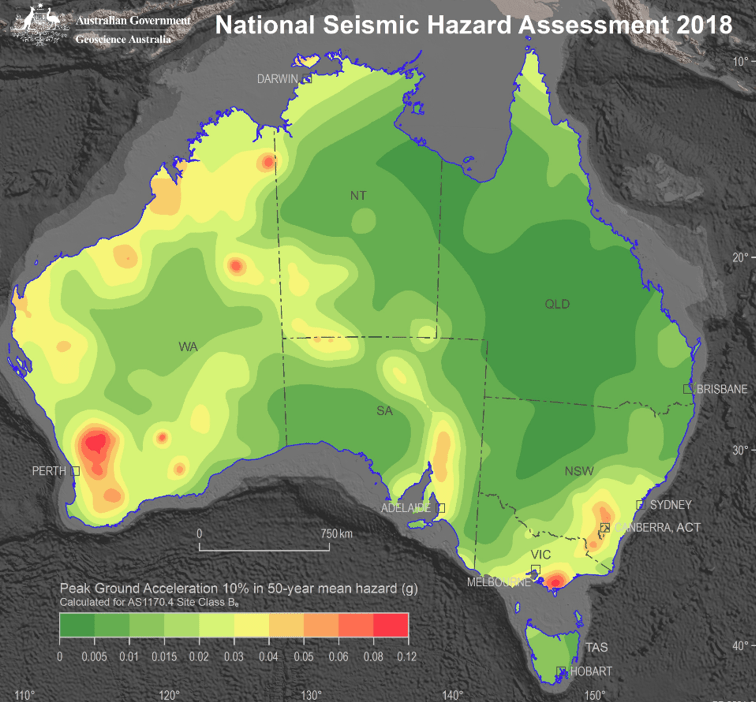
I don't think that's correct. That's a 10% probability in 50 years, which is actually a 475y return period.
500y return period will be roughly 1.05 times that, so 0.033

See below the 2018 map

Screenshot_2024-08-09_131750_lnaovr.png


human909 said:
Only three years ago Melbourne felt a 'decently' sized tremor. The epicentre at Mansfield 130km away has PEAK GROUND ACCELATION of 0.20g, so almost 7 times the figure above if you didn't notice the decimal shift. We had an after shock just 2 days ago.

That's quite concerning actually, it goes to show how these assessments can be relied upon only to a certain extent, especially because of the limited historical data we have for Australia, and I'm glad the approach is somewhat conservative in keeping the old Z values for design.
 
Actually, sometime ago I took some interest in this matter and created a little tool that plotted all the raw data on a map (actual towns only), you can hover on it and see all the different values for each location, for whoever interested you can find it attached here (download and open with your browser):
 
 https://files.engineering.com/getfile.aspx?folder=9cfd2a84-9549-4c09-96c2-3dc55271aede&file=interactive_australia_seismic_hazard_map.html
li0ngalahad said:
I don't think that's correct. That's a 10% probability in 50 years, which is actually a 475y return period.
Fair call.

li0ngalahad said:
That's quite concerning actually, it goes to show how these assessments can be relied upon only to a certain extent, especially because of the limited historical data we have for Australia, and I'm glad the approach is somewhat conservative in keeping the old Z values for design.
Exactly.

That very like magnitude spike North East of Pert is Meckering. It is based off ONE big data point (and likely several smaller ones). That data point less than 60 years ago. It speaks volumes that our understanding is more REACTIONARY rather than well informed predictive.

Who says there isn't a similar one sitting under Perth? Or Adelaide, or almost anywhere? When we have such a limited record we are really just guessing. I'm sure the Boffins are doing their very best guessing, but examining the stresses a dozen kilometres deep in the crust isn't an easily task.

On the more positive side. The recurrence period is accepted as very long. Yes the risk is there, but it is low. As an aside, technically half of Victoria is volcanically active and we could have a large eruption or extrusive flow at any time... Any time being a recurrence rate of ~4000 years or so. And also most volcanic activity give far more forewarning signals than seismic activity.
 
Status
Not open for further replies.

Part and Inventory Search

Sponsor