Continue to Site

Eng-Tips is the largest engineering community on the Internet

Intelligent Work Forums for Engineering Professionals

  • Congratulations IFRs on being selected by the Eng-Tips community for having the most helpful posts in the forums last week. Way to Go!

Bi-axial bending chart - concrete column 29

Pretty Girl

Structural
Nov 22, 2022
100
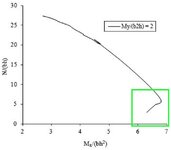
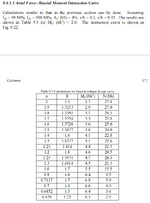
This is from "Reinforced concrete design to eurocodes" by prab bhat, page 371 and 372.
It has mentioned the it's for My/ (hb^2) = 2.

But I don't know how to reproduce with that ratio kept constant. So, I tried to create it with making the alpha and beta values at a constant ratio of 0.8 (beta = 0.8 alpha). Then I produced a chart.

Since I didn't reproduce the exact chart in the book, now I have another problem. I have got no reference chart to compare my chart with. Can anyone kindly help me find out if my chart is correct for the column dimensions and data I provided.

Are there any free software/ excel sheet to enter the column details mentioned below and compare it with my chart?

I'm concerned that my chart may not be correct as I don't see the part the book's chart have I have shown in the green rectangle below, when I produce my chart. I understand it cannot be the same chart, but if my chart is correct that "nose" like curve should also be in my chart isn't it.

1. Chart from the book
1734934729980.png
Untitled 5.jpg


2. The chart I produced

This is a rectangular column, h = 2000 mm, b = 1000 mm. I maintained "beta/ alpha ratio = 0.8".
4 reinforcement bars, 1 bar each corner. Steel percentage 4% (So, 1% bh area for each bar).
40 mm distance from column surface to the centroid of r/f for each bar.
fck = 30 MPa, fcd = 20 MPa, fyk = 500 MPa, fyd = 434.7 MPa.
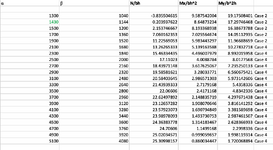
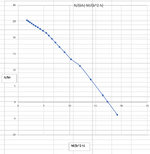
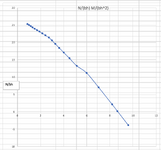
Screenshot 2024-12-23 at 5.14.55 pm.png

Screenshot 2024-12-23 at 5.14.33 pm.png
Screenshot 2024-12-23 at 5.14.21 pm.png
 
Last edited:
Replies continue below

Recommended for you

Why do you say the angle doesn't go all the way to 90 degrees? The resultant moment with zero moment about the Y axis will be parallel to the Y axis, and zero moment about the X axis will be parallel to the X axis.
 
Interaction 3d plot should be
Z-axis = N
X-axis = Mx
Y-axis = My

A second useful plot is a 2d plot of
Y-axis = neutral axis angle
X-axis = resultant moment angle, atan2(my,mx)
 
@IDS

Thank you for the response.

When I calculate neutral axis angles near to x axis it won't calculate, throws errors. may be some of the data in the calculation gets too big than excel can handle, IDK. Seems to be some issue how I calculate near x axis angles, say 1 degrees from x axis and it throws errors in excel, but 5+ degrees it's fine. So I thought it is not going all the way to zero. I'll try to calculate it in some other way. Not a big deal it seems as all the other calculations are ok.

@Celt83

Thank you for the response. I'll plot that as well eventually. Most probably after combining the concrete calculation as well.


@IDS and @Celt83
Now I decided to move on to calculate the concrete forces and moments.

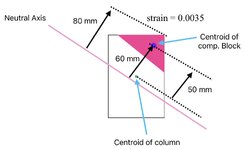
for the following figure, did I do the calculation correctly? or is it wrong?

Screenshot 2025-02-14 at 10.18.45 pm.jpg


Strain
= (0.0035/80) * 60 = 0.002

Stress
fck = 40 MPa
α = 0.85 (UK) (for long term effects?)
fcd = 0.85 * fck/1.5 = 0.85 * 40/1.5 = 22.66 MPa = aprox. 20 MPa
E (youngs modulus) of concrete = 30 GPa (for 20 MPa concrete) (Table 3.1, Eurocode)
= (E * strain) ≤ fcd
= 30 * 10^3 * 0.002 = 60 MPa
= limit is fcd, so answer is lesser of 62 MPa and 26.66 MPa
= 26.66 MPa.

Axial force
η = 1
since compression block is pointy: 0.9 (mentioned in eurocodes)

= 0.9 * 1 * stress * area
lets say, area of the compression block (triangular) = 1000 mm^2
= 0.9 * 1 * 26.66 * 1000 = 23994 Newtons

Moment

= distance from centroid * axial force
= 50 * 23994 = 1199700 Nmm = 1.2 kNm
 
Last edited:
A couple of points:

1. I see where you are coming from, but there is no need to calculate the strain at the centroid and check the stress. The rectangular stress block is an approximation defined by the code that assumes a constant stress over the depth of the block, and zero stress outside it, so just use the stress defined by the code x the area to get the force.

2. In general the NA direction will not be perpendicular to the principal axis of the resultant moment, so you need to take moments in perpendicular directions, as for the reinforcement. See my spreadsheet posted before for details.
 
A couple of points:

1. I see where you are coming from, but there is no need to calculate the strain at the centroid and check the stress. The rectangular stress block is an approximation defined by the code that assumes a constant stress over the depth of the block, and zero stress outside it, so just use the stress defined by the code x the area to get the force.

ok. so it should be done as follows for the stress and axial force calculation (not considering any strain gradients)

Stress

fcd = 0.85 * fck/1.5
= 0.85 * 40/1.5
= 22.66 MPa

Axial force
= stress * area

η = 1
since compression block is pointy: 0.9 (mentioned in eurocodes)

= 0.9 * 1 * stress * area
lets say, area of the compression block (triangular) = 1000 mm^2
= 0.9 * 1 * 26.66 * 1000 = 23994 Newtons

2. In general the NA direction will not be perpendicular to the principal axis of the resultant moment, so you need to take moments in perpendicular directions, as for the reinforcement. See my spreadsheet posted before for details.

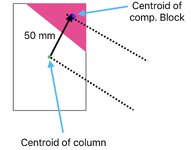
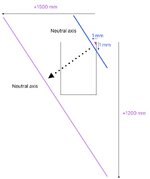
I'm bit confused. I'm trying to calculate using the rotated axis. Can't we do that for the concrete? we did it for the r/f (the previous spreadsheet you provided). The 50 mm distance is the distance from centroid of column (green dot) to the centroid of concrete compression block (purple dot). I don't get how the resultant moment direction has any relation to the moment calculation.

Screenshot 2025-02-15 at 8.25.17 pm.jpg

Are you saying the following moment calculation is right or wrong?

Moment

= distance from centroid of column to the centroid of compression block * axial force
= 50 mm * 23994 Newtons = 1199700 Nmm = 1.2 kNm
 
Last edited:
Don’t take moments about the centroid perpendicular to the neutral axis this won’t yield a useful result.

Using the global x and y axis Compute Mx and My about the column centroid, this is what we did for the reinforcement.
 
Don’t take moments about the centroid perpendicular to the neutral axis this won’t yield a useful result.

Using the global x and y axis Compute Mx and My about the column centroid, this is what we did for the reinforcement.

@Celt83 @IDS
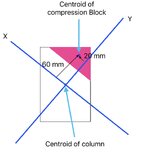
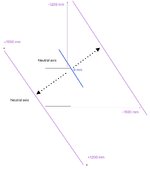
When we calculate the r/f moments, we measured the distance from each rotated x and y axis to the centroid of r/f. So, if we apply the same method,

60 mm and 20 mm are perpendicular distances to the centroid of compression block, from rotated each x and y axis.

Is the following right or wrong?

Moment

Mx = (distance from centroid of compression block to rotated x axis) * axial force
= 60 mm * 23994 Newtons = 1439640 Nmm = 1.44 kNm

My = (distance from centroid of compression block to rotated y axis) * axial force
= -20 mm * 23994 Newtons = -479880 Nmm = -0.48 kNm

resultant moment = (mx^2 + my^2)^0.5
= (1.44^2 + -0.48^2)^0.5
= (2.07 + -0.23)^0.5
= 1.35 kNm

Screenshot 2025-02-16 at 1.06.44 am.jpg
 
Last edited:
The calculation of Mx and My is correct.

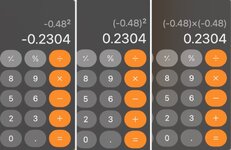
-0.48^2 = +0.23, so the resultant moment should be (2.074+0.23)^0.5 =1.52 kNm.

You could also calculate the lever arm between the two centroids, = 63.25 mm, and that gives exactly the same result, but to combine the concrete moment with the reinforcement moment you need to calculate the total Mx and My separately, then combine those to get the resultant moment magnitude and direction.

Thank you for the response.
Its strange that directly typing "^2" provides a different answer than inserting brackets or multiplying it by itself in macOS default calculator.
However, excel resulted in your answer "+0.23".

Seems like I need to learn how to use a simple calculator and understand where brackets are needed. Or stick to excel for even simple calcs.

Screenshot 2025-02-16 at 3.53.04 pm.jpg
 
Just remember, the resultant forms the hypotenuse of a right angled triangle, so it must be longer than either of the two components.
 
Just remember, the resultant forms the hypotenuse of a right angled triangle, so it must be longer than either of the two components.

Thank you for the response.

@IDS @Celt83

Further, is the total moment for each axis given by just summing up both axial and moments, to get the data to draw the 3d interaction chart?

Example
(only for a one chart point as an example, there will be thousands of these):

lets say neutral axis is positioned somewhere in the column, and at that neutral axis position, we calculated the following answers.

axial force
steel = 110 kN
concrete = 140 kN

Mx
steel moment = 10 kNm
concrete moment = 20 kNm

My
steel moment = 35 kNm
concrete moment = 15 kNm

so the calculation,
Total axial force (to be used for the interaction chart) = Steel Axial + Concrete Axial
= 110 kN + 140 kN = 250 kN

(Mx)
Total moment (to be used for the interaction chart) = steel moment + concrete moment
= 10 kNm + 20 kNm = 30 kNm

(My)
Total moment (to be used for the interaction chart) = steel moment + concrete moment
= 35 kNm + 15 kNm = 50 kNm

and the direction (from x axis) is
= atan2 (my, mx)
= atan2 (50, 30)
= 30.9 degrees

if neutral axis angle is 16 degrees from x axis,
direction from neutral axis = 30.9-16 = 14.9 degrees


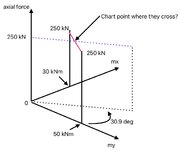
So, for the chart I will use those answers like this? so I should use the point where they cross? or should I use them some other way? The following image only shows one single chart point.

Screenshot 2025-02-21 at 1.01.28 am.jpg
 
I believe most people will plot a point in 3d space, at P, Mx, My for a given neutral axis angle. No need to find the point where they cross, just plot (P, Mx, My)

In the gif below, each point on this 3d plot is for a given neutral axis angle of 45 degress.

concJS.gif
 
Thank you for the response.

@IDS @Celt83

Further, is the total moment for each axis given by just summing up both axial and moments, to get the data to draw the 3d interaction chart?

Example
(only for a one chart point as an example, there will be thousands of these):

lets say neutral axis is positioned somewhere in the column, and at that neutral axis position, we calculated the following answers.

axial force
steel = 110 kN
concrete = 140 kN

Mx
steel moment = 10 kNm
concrete moment = 20 kNm

My
steel moment = 35 kNm
concrete moment = 15 kNm

so the calculation,
Total axial force (to be used for the interaction chart) = Steel Axial + Concrete Axial
= 110 kN + 140 kN = 250 kN

(Mx)
Total moment (to be used for the interaction chart) = steel moment + concrete moment
= 10 kNm + 20 kNm = 30 kNm

(My)
Total moment (to be used for the interaction chart) = steel moment + concrete moment
= 35 kNm + 15 kNm = 50 kNm

and the direction (from x axis) is
= atan2 (my, mx)
= atan2 (50, 30)
= 30.9 degrees

if neutral axis angle is 16 degrees from x axis,
direction from neutral axis = 30.9-16 = 14.9 degrees


So, for the chart I will use those answers like this? so I should use the point where they cross? or should I use them some other way? The following image only shows one single chart point.

View attachment 5205
I am not sure what you mean by "the point where they cross", but as sticksandtriangles suggested, if you must have a 3D plot, you have Mx, My and the axial load, so you have three coordinates defining a point in 3D space, so you can generate as many points as you want.

For practical applications I would suggest plotting as a 2D graph with axes Mx and My, and a series of lines for specified axial loads, covering the range encountered in the element being designed.
 
@IDS @sticksandtriangles @Celt83

Thank you for the responses. I used the Axial, Mx, My, these three data to plot it.
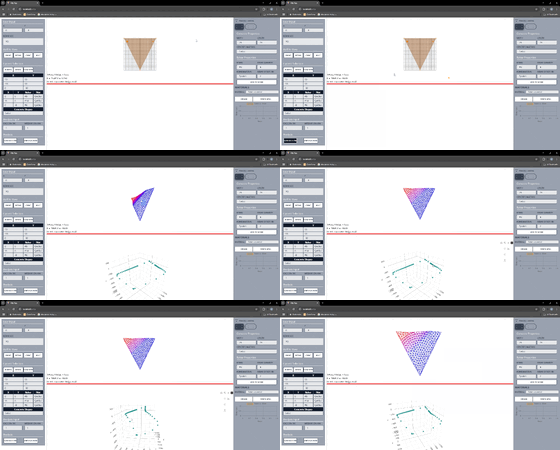
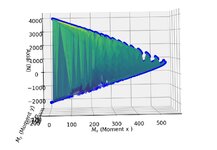
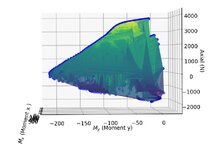
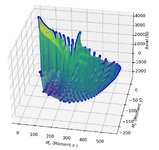
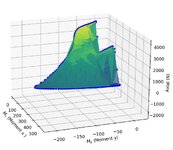
I used some python code to generate the 3d surface. However, it looks weird at some angles, and does not show as a bulb etc, which I was expecting. I understand it cannot be a full bulb (because our range is 0-90 degrees), but at some angles it doesn't even look like quarter bulb.

Is this correct or I got something wrong? This is for a 500 mm x 250 mm column, with four bars as we calculated earlier.

The python code is also attached with this post (I renamed it as .txt file as this composer does not allow me to attach .py files. So, pls rename the extension to .py after you download the file)

Further, I want to know if I summed up the forces in the following example table. I'm asking this because may be the graph is weird because I summed up in incorrect way. Should I stop My or Mx going in the negative side (capping minimum at zero) for steel etc like 14.33-0, than just deducting the negative steel force from positive concrete 14.33 -169 = -154.79 etc? or the calculation is correct?

Concrete​
Steel​
Total​
Axial​
235.008​
-630.354​
-395.346​
kN​
Mx​
46.21824​
281.006​
327.22424​
kNm​
My​
14.335488​
-169.129​
-154.793512​
kNm​


Screenshot 2025-02-22 at 2.11.06 pm.jpg
Screenshot 2025-02-22 at 2.12.02 pm.jpg
Screenshot 2025-02-22 at 2.12.46 pm.jpg
Screenshot 2025-02-22 at 2.13.31 pm.jpg
 

Attachments

  • gra-ets1.txt
    102.5 KB · Views: 4
Last edited:
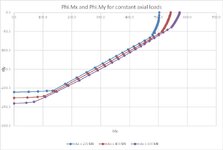
It's hard to tell if your results are right or not. That's the problem with 3D plots! I have attached a 2D interaction diagram for 3 axial loads below. For design purposes that seems to me a much better way of plotting the results. I used 40 MPa concrete with 40 mm bars and with the 0.85 reduction factor on concrete stress from the UK Annex.

Regarding your tabulated values, you should definitely sum the positive and negative moments, why wouldn't you? Assuming your positive stresses are compression, that section is in tension. Is that what you intended? If you provide the NA position you used for that table, and confirm the concrete and steel strengths and bar diameters, I will check if I get the same numbers.

Biax-interact.jpg
 
It's hard to tell if your results are right or not. That's the problem with 3D plots! I have attached a 2D interaction diagram for 3 axial loads below. For design purposes that seems to me a much better way of plotting the results. I used 40 MPa concrete with 40 mm bars and with the 0.85 reduction factor on concrete stress from the UK Annex.

Regarding your tabulated values, you should definitely sum the positive and negative moments, why wouldn't you? Assuming your positive stresses are compression, that section is in tension. Is that what you intended? If you provide the NA position you used for that table, and confirm the concrete and steel strengths and bar diameters, I will check if I get the same numbers.

View attachment 5337

@IDS
Thank you for the response.

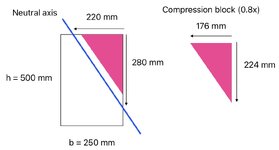
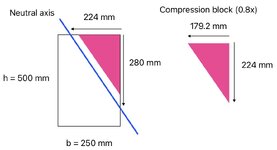
This is for a column with, h = 500, b = 250, fck = 40 Mpa (so, fcd = 22.667 Mpa), r/f diameter = 25 mm, concrete cover = 30 mm (so from outer surface to centre of r/f = 42.5 mm), fyk = 500 Mpa (so, fyd = 434.783), Neutral axis position, 280 mm from top, 220 mm from right side (I maintained the ratio (224/280 = 0.8, while moving the neutral axis back and forth to get the values).

Screenshot 2025-02-23 at 1.53.13 pm.jpg

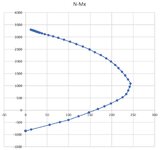
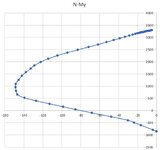
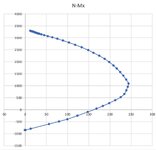
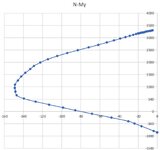
Although I don't get how you fixed the Axial force at 200, 400 etc, I just tried to draw the actual N-M interaction in 2D. Is this correct or wrong? The data used for this is shown below in the table.

Further, I actually want to build the 3D interaction surface, so If you or anyone else can use the complete set of data with varying angles, to build the 3D surface, the full data set is here if you can try --> https://docs.google.com/spreadsheets/d/1aBSvgExzAAx7aWmUKDzR9JgOKIt75cvZYXzXlfsLUkk/edit?usp=sharing.


Concrete​
Steel​
Total​
Axial​
409.43616​
-251.395​
158.04116​
kN​
Mx​
71.78780672​
125.483​
197.2708067​
kNm​
My​
26.72253338​
19.41​
46.13253338​
kNm​


Screenshot 2025-02-23 at 4.57.42 pm.jpg

(This is negative, should it be?)
Screenshot 2025-02-23 at 4.58.07 pm.jpg

Axial​
Mx​
My​
-853.68878​
-0.7485744​
-0.0833062​
-848.99384​
0.48759913​
-0.3688167​
-793.27636​
13.0463901​
-3.9665684​
-597.96956​
55.8727864​
-16.678707​
-490.29144​
79.3592613​
-23.842685​
-396.449​
99.2441683​
-30.305954​
-250.87124​
123.133665​
-48.070967​
-94.15116​
147.048796​
-68.375176​
46.73124​
167.973652​
-85.741032​
156.96796​
182.969721​
-98.600988​
279.438​
198.308274​
-113.1278​
403.68​
212.55412​
-127.26788​
524.215​
224.930371​
-139.56045​
657.007​
233.72231​
-146.94839​
809.993​
238.201778​
-148.18425​
955.637​
241.547912​
-148.81907​
1095.315​
243.687432​
-148.74881​
1262.013​
237.758825​
-145.80701​
1421.857​
231.143353​
-142.18414​
1575.183​
223.86294​
-137.87698​
1722.968​
215.800728​
-132.77126​
1854.878​
208.085942​
-129.0194​
1993.812​
198.192331​
-122.20572​
2128.78​
187.213804​
-114.4047​
2255.62​
174.630037​
-104.70073​
2380.146​
160.94764​
-94.08184​
2491.499​
148.52291​
-83.279622​
2607.84236​
133.101175​
-71.861288​
2713.16956​
117.84677​
-61.82393​
2807.64044​
103.045867​
-53.030376​
2891.4​
88.9232948​
-45.422592​
2964.57524​
75.7326709​
-38.922061​
3027.27716​
63.7692126​
-33.441664​
3079.60376​
53.2715674​
-28.926679​
3121.64104​
44.5234661​
-25.265548​
3153.465​
37.7978041​
-22.422601​
3175.14364​
33.3319013​
-20.31898​
3188.115​
31.062​
-18.806​
3199.469​
29.153​
-17.421​
3210.241​
27.342​
-16.106​
3220.474​
25.622​
-14.858​
3230.208​
23.985​
-13.67​
3239.479​
22.427​
-12.539​
3248.317​
20.94​
-11.461​
3256.755​
19.522​
-10.432​
3264.817​
18.166​
-9.448​
3272.53​
16.87​
-8.507​
3279.913​
15.628​
-7.607​
3286.989​
14.439​
-6.743​
3293.776​
13.297​
-5.915​
3300.292​
12.202​
-5.12​

@IDS @Celt83 @sticksandtriangles
 
Last edited:

Part and Inventory Search

Sponsor