Continue to Site

Eng-Tips is the largest engineering community on the Internet

Intelligent Work Forums for Engineering Professionals

  • Congratulations KootK on being selected by the Eng-Tips community for having the most helpful posts in the forums last week. Way to Go!

Llano River Bridge Collapse in Texas 21

Status
Not open for further replies.

JAE

Structural
Jun 27, 2000
15,444
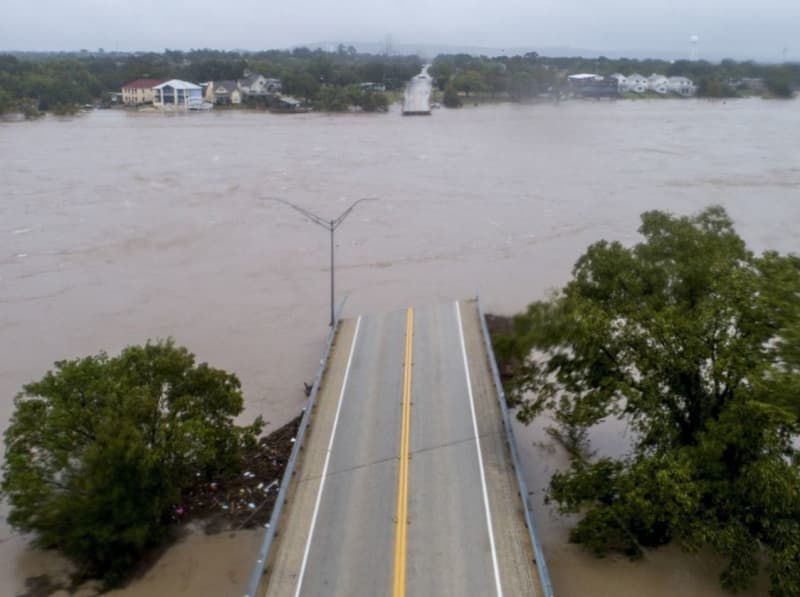
Video of the collapse due to high river:

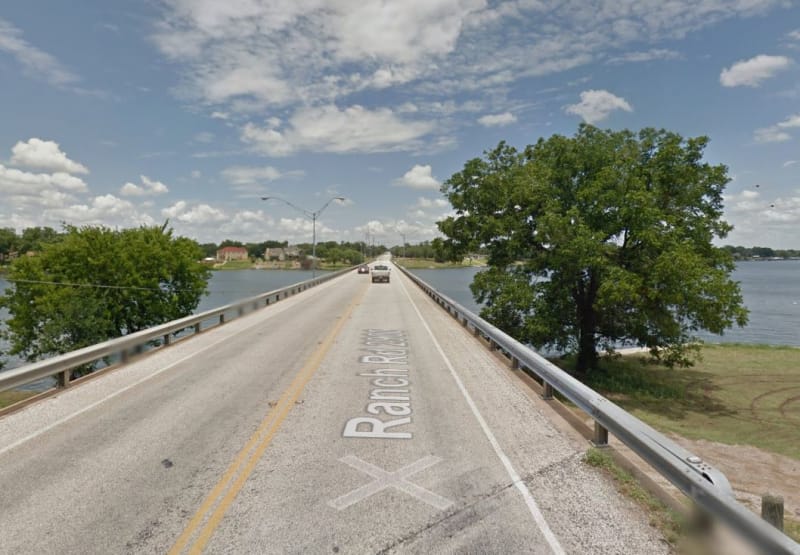
Before:
Llano_River_Bridge_Before_jfixlz.jpg


After:
Llano_River_Bridge_After_hw0mzx.jpg


Check out Eng-Tips Forum's Policies here:
faq731-376
 
Replies continue below

Recommended for you

"4 to 8 inches over 4 days" consists of a series of light showers where I am. We just had that, and it helped to turn the grass green, but certainly no flooding. Must have been more than that, or the topography is really strange.
 
That depends on the how the runoff gets to the river. The end result was 37 ft river rise in about a day, which could certainly be due to poor ground absorption. 1-inch rain in a short time in parts of Los Angeles would result in flooded streets.

TTFN (ta ta for now)
I can do absolutely anything. I'm an expert! faq731-376 forum1529 Entire Forum list
 
It all depends on what's normal for the area. Apparently, 4-8" is a typical monthly total for that area. Here, 4" would be nearly 6 months worth of rain, and 8" close to our yearly average. Needless to say, 2" of rain at one time causes major flooding. It all depends on the capacity of the river channel and the drainage area. That said, major flooding from a typical monthly rainfall amount in 4 days, did seem odd, so I looked at the monthly averages for Austin. There are a few months where the monthly average precipitation tops 4", but the highest is 4.37" in May, following the driest 6 months of the year. October is toward the end of the 'wet season', and it's not just the 4-8" in the 4 days, it's whether the ground was already saturated when that heavy rain fell.
 
In Orange Co (CA), the official rainfall for the year (Oct 2017 to Oct 2018) was less than 1.8 inches (the historical normal is closer to 13 inches). Now we appear to be starting out on a better note this season as we had a thunderstorm on Saturday that dropped 0.4 inches of rain in 24 hours (no reported flooding). It's also been reported that we will have an El Niño condition in the Pacific this winter which could mean a wetter than normal rainy season. We can only hope...

John R. Baker, P.E. (ret)
EX-Product 'Evangelist'
Irvine, CA
Siemens PLM:
UG/NX Museum:

The secret of life is not finding someone to live with
It's finding someone you can't live without
 
John,
Sorry to be a contrarian, and I do hope you get some rain, but an El Nino means less rain for Australia, and we need it. We like the La Nina condition better.
 
msquared48 said:
100 year storms now are not what they were 83 years ago... Computer models are always changing as more data enters the system.


A NOAA analysis released today finds significantly higher rainfall frequency values in parts of Texas, redefining the amount of rainfall it takes to qualify as a 100-year or 1000-year event.

The study, published as NOAA Atlas 14, Volume 11 Precipitation-Frequency Atlas of the United States, Texas, found increased values in parts of Texas, including larger cities such as Austin and Houston, that will result in changes to the rainfall amounts that define 100-year events, which are those that on average occur every 100 years or have a one percent chance of happening in any given year. In Austin, for example, 100-year rainfall amounts for 24 hours increased as much as three inches up to 13 inches. 100-year estimates around Houston increased from 13 inches to 18 inches and values previously classified as 100-year events are now much more frequent 25-year events.

NOAA Atlas 14 rainfall values are used for infrastructure design and planning activities under federal, state and local regulations. They also help delineate flood risks, manage development in floodplains for FEMA’s National Flood Insurance Program and are used to monitor precipitation observations and forecasts that can indicate flooding threats by NOAA’s National Weather Service.
 
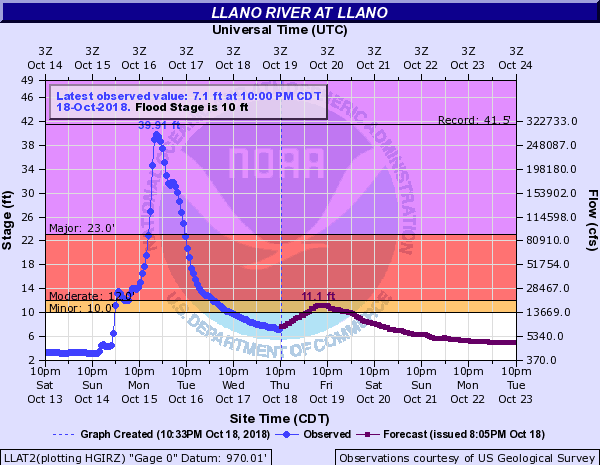
llat2_hg_kubhaw.png


38 Robinson City Park in Llano will flood. Many homes in Scotts Acres on south side of Llano will be severely damaged and lowest mobile homes destroyed in water up to 6 feet, some washing downstream. Many homes near Castell to below Llano will be damaged. The FM 2900 bridge in Kingsland will flood. Much of Kingsland Lodge in Kingsland will be destroyed. Many homes downstream in Marble Falls will flood as flow backs up Backbone Creek.

36 Disastrous life threatening flooding will damage numerous homes and businesses above Castell to Lake LBJ. Numerous resorts at and below Kingsland near the Llano River mouth will flood severely. Boats, docks and any gear that isn't removed from the river will be destroyed. Lower homes on Lake Travis flood severely. Flow exceeds the USGS 1:50 year flood level.

32 Disastrous flooding well into the flood plain will cut off and potentially drown thousands of livestock. Homes, resorts, commercial buildings, boats, docks and marinas will flood disastrously above Castell to Marble Falls on Lake LBJ. Roads and bridges near the river will be severely flooded and dangerous to motorists. Exceeds the USGS 1:25 year flood.

30 Disastrous flooding will reach lowest residences below Castell to below Llano. Flow will be to the slab of the city of Llano water treatment plant on the right bank just above Highway 16. Numerous resorts at Kingsland and in Lake LBJ will have severe flood damage. Boats, docks and facilities lining the lower Llano and Lake LBJ near Kingsland may be severely damaged or destroyed.

26 Major flooding will threaten lowest homes from upstream near Castell to below Llano. Major damage will occur downsteam in Kingsland to boats and docks. Secondary and primary roads and bridges in the flood plain will be extremely dangerous to motorists. Lowest homes and businesses in the Highland Lakes below Kingsland will be flooded.

23 Major lowland flooding makes primary and secondary roads and low bridges near the river and tributaries dangerous. Boats and docks are severely inundated downstream near and in Kingsland. Lowest resorts near the Llano River mouth in Kingsland flood.

20 Flow will be damaging to docks and boats downstream in Kingsland. The lowest secondary roads and bridges will be severely flooded and dangerous. Near the USGS 1:5 year flood level.

16 Moderate lowland flooding threatens docks and boats in the flood plain downstream in Kingsland. Secondary roads and bridges will be flooded and dangerous to motorists. Flow exceeds the USGS 1:2 year flood level.

12 Moderate lowland flooding makes secondary roads and low bridges in the flood plain dangerous to motorists. Equipment should be moved from low docks and boat ties loosened downstream in Kingsland.

10 Minor lowland flooding can swamp boats in the lower Llano River in Kingsland.

Historic Crests
(1) 41.50 ft on 06/14/1935
(2) 39.10 ft on 06/23/1997
(3) 32.60 ft on 09/10/1952
(4) 28.65 ft on 11/04/2000
(5) 22.07 ft on 11/17/2004
(6) 20.51 ft on 02/04/1992
(7) 20.50 ft on 06/27/2007
(8) 12.63 ft on 06/01/2016
(9) 12.13 ft on 05/29/2015
(10) 11.24 ft on 07/06/2002

 
HotRod10 said:
"This type of storm, and the hurricanes, continue to get more frequent and more severe."

Yeah, I heard the same fear-mongering from the IPCC, too. The problem is that the evidence doesn't actually support that assumption.
It's seems like there is ample evidence that extreme precipitation events are on the increase. Not limited to the specific statistical analysis that's relevant in this case which shows: In Austin, for example, 100-year rainfall amounts for 24 hours increased as much as three inches up to 13 inches. 100-year estimates around Houston increased from 13 inches to 18 inches and values previously classified as 100-year events are now much more frequent 25-year events.

That seems pretty straightforward. What is it we are missing?
 
So, perhaps the rainfall patterns in Texas are changing. If they are, what does it mean?

That the bridge was underdesigned? No, not necessarily. The design would have been based on the information available at the time, and we haven't been presented with what the design criteria was.

That the changes are due to global warming? Assuming that global warming is a real, long term trend, and not a normal cyclic fluctuation (and assuming it's not a completely fabricated phenomenon), it's only wild speculation, with no scientific foundation, that rainfall in Texas would be affected.

Actually, the heavy rainfall that caused this flooding on the Llano River was the result of a Pacific hurricane named Sergio.
 
Spartan5 said:
100-year estimates around Houston increased from 13 inches to 18 inches and values previously classified as 100-year events are now much more frequent 25-year events.
Perhaps previous estimates were in error? Please consider this is a question, not a statement.

Brad Waybright

It's all okay as long as it's okay.
 
"What is it we are missing?"

The fact that, as IRstuff pointed out, we only have 200 years worth of data to work with, and only about the last 100 years for which we have actual measurements. To set the criteria for what constitutes a 100-year (or even 25-year) event with any accuracy, you need far more 100 or even 200 years worth of data. Also, statistically speaking, 2 or even 3 "100-year events" can happen within a few years of each other; that doesn't suddenly make them 5-year events.

Anyway, my comment was primarily aimed at the assertion of hurricanes becoming more frequent and more severe, which is not supported by the facts.
 
HotRod10 said:
So, perhaps the rainfall patterns in Texas are changing. If they are, what does it mean?

It means that you were wrong when you claimed that the statement "This type of storm, and the hurricanes, continue to get more frequent and more severe" was fear-mongering and unsupported by evidence. There's the evidence for you. There is evidence that it's not just Texas. Do you want to read more studies?

Hurricane Sergio, by the way, was the record setting eighth Category 4 hurricane to form in the East Pacific this year. The old record of seven Category 4 having only been set in 2015. All just a strange coincidence I guess.
 
HotRod10 said:
To set the criteria for what constitutes a 100-year (or even 25-year) event with any accuracy, you need far more 100 or even 200 years worth of data.
Sez who?

Have you ever cracked open a copy of Atlas 14? The statistical analysis is all there (with confidence intervals) in hundreds of pages of details. It's not like they are licking their finger and sticking it in the wind.

 
"There is evidence that it's not just Texas. Do you want to read more studies?"

Regional rainfall patterns change. Regional rainfall patterns have changed throughout recorded history. There is historical evidence of changing regional rainfall patterns as far back as you care to go. It's not evidence of anything other than the Earth is constantly changing, as it has since it was created.

"All just a strange coincidence I guess."

Technically, it's a statistical anomoly, but you can buy into the junk science if you choose.

"Sez who?"

My college statistics teacher...and the book he taught from.
 
To clarify, there is no scientific body that rejects the fact the that climate change is occurring. There is no scientific debate about the issue. Even the oil companies begrudgingly agree. The moon landing wasn't fake, the earth isn't flat, and climate change isn't a hoax.
 
The climate is always changing, regionally and globally. Of course no credible scientist would deny such an obvious fact. However, a sustained global warming trend is not a fact; it's a hypothesis still in search of supporting evidence. Beyond that, the supposition that a warming climate produces more frequent and severe storms and hurricanes, is speculation not supported by the evidence. There is actually a substantial amount of evidence to the contrary.
 
HotRod10 said:
Technically, it's a statistical anomoly, but you can buy into the junk science if you choose.
At first you claimed that talk of changes in extreme precipitation events was fear-mongering not supported by evidence. Then you wavered and said well maybe it's just Texas. Finally there was the hard pivot to "Things change. Things have always changed. There is evidence things have changed as far back as you can go. There is constant change." But I'm the one that has bought into something?

What have I presented that's the junk science you claim I have bought into?

Though I'm not even really sure what your position is at this point, I'm curious; aside from anonymous professors and their unnamed textbooks, do you have anything to contribute from reputable sources (say something not founded by a political hack with no education in the field of climate science)? Substantial amounts of actual science is what I'm specifically looking for here. Climate Depot is a cesspool. Granted, there might be a grain of knowledge there... somewhere... maybe. But I've never been one to dive into a septic tank just because someone might have dropped a gold ring in it.
 
HotRod10 said:
Also, statistically speaking, 2 or even 3 "100-year events" can happen within a few years of each other; that doesn't suddenly make them 5-year events.
A 100 year event, by definition, indicates probability to occur in any given location during a 100 year span. Many 100 year events should be expected to occur in various locations during a 100 year span. Since this storm didn't hit Louisiana, and one might hit there next week does not qualify to assert that two 100 year floods within 2 weeks occurred.

Brad Waybright

It's all okay as long as it's okay.
 
You know, it makes me curious when they started using the concept of a 100-year flood. Anybody know when that was? More to the point, did they even use that concept 50 years ago? Or was it a matter of "the water hasn't ever come up this high, so let's put the bridge here".
 
Recurrence intervals on storm events for flood events have been used at least since the 1930's. No idea its use before then, though it wouldnt surprise me if it was used prior to the 1930's. The math of it isnt too complex. I've seen it on historical drawings/projects I've worked on. For wind, seismic events, I think the use of recurrence intervals is a little more recent.

 
Status
Not open for further replies.

Part and Inventory Search

Sponsor