Eng-Tips is the largest engineering community on the Internet

Intelligent Work Forums for Engineering Professionals

  • Congratulations waross on being selected by the Tek-Tips community for having the most helpful posts in the forums last week. Way to Go!

Strange results

Status
Not open for further replies.

Daniele1989

Automotive
Feb 15, 2019
19
0
0
IT
Hi everyone,
I've a problem on my model.
I installed a new ansys version (2019 R1) in a new PC.
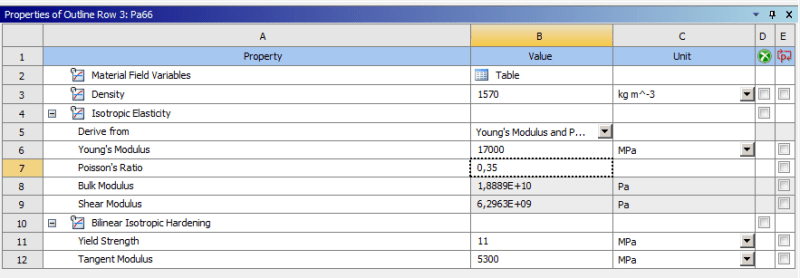
I insert a plastic material data and start to do a calculation:

Young Modulus: 17000 MPa
Poisson ratio: 0.35
mm/mm MPa
0 11
0,00129 60
0,00340 95
0,00888 140,5
0,01399 158,3
0,01798 169,1
0,0240 171,5
0,02883 171,9
0,02954 172

1_knxdoh.png

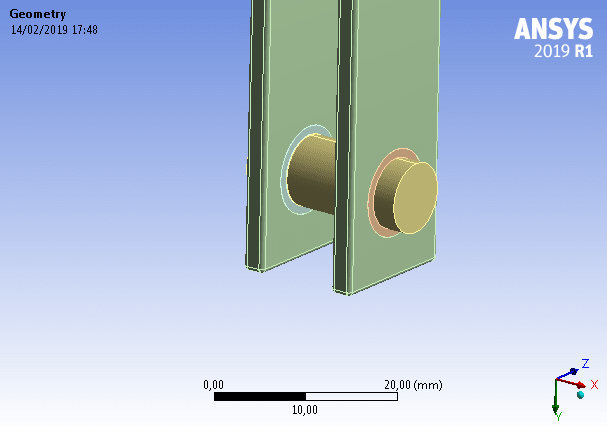
This is what i'm doing and i have a metal pin inserted in two metal bushings comolded with structure in plastic material. (With metal i mean "Structural steel" of Ansys)
Contacts are:
- pin and bushes FRICTIONAL
- bushes and hole BONDED

I applied a positive Load of 2kN on Y on the pin and i see a strange behaviour:

2_gt2osz.png


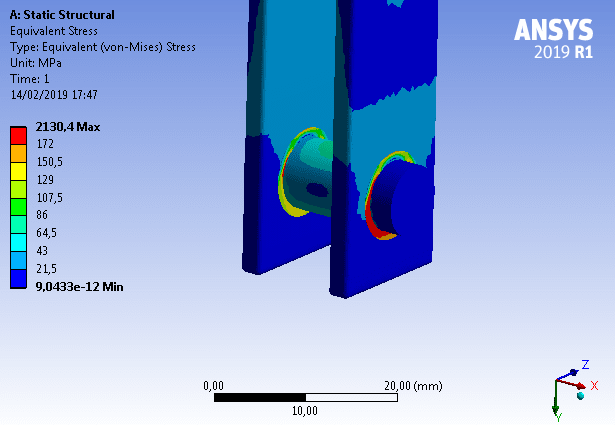
According to you what's wrong in the model? According to me i need to have a compression tension below the bushes, and lower tension on bushes.

Thank you!
 
Replies continue below

Recommended for you

In my opinion the contact definitions are correct. What does the stress-strain curve look like?
There is nothing preventing the pin sliding in x direction. You should apply the load slowly
so the friction should keep it in place.
 
I recreated your model by scaling dimensions by eye. It seems to run fine and the stresses look reasonable. One thing, you say you need compression below the bushes, but show a plot of von Mises stress. You do realize that von Mises stress is always positive? Check the definition and you'll see it does a square root sum of squares thing, so negatives vanish. Take at look at sigma y and see if that makes sense. Also, your peak stress seems high in comparison to the rest of your stresses. take a look at your mesh. If its too course, you'll get faceting effects between the pin and the bush that will give high stress.


Rick Fischer
Principal Engineer
Argonne National Laboratory
 
 https://files.engineering.com/getfile.aspx?folder=46dbe019-9803-4cea-b893-3a71307f3002&file=sdgh.jpeg
Hi,
thanks L_K and rickfischer51 to reply.
I think that there's a problem on material data input. I inserted data (Stress strain) on "Multilinear isotropic hardening" (Plasticity), is it correct?

The problem is that in steel bushes there's too high stress in comparison with palastic material in contact with bushes.

I tried to make analysis on this model with every component in structural steel and i found something more "Clear". Picture below:
1121_g7ix2v.png

Here bushes are less compressed and it's correct according to me.

I have a dubt to section where i inserted material data.

Thank you
 
Because of the plasticity, it is important to ramp up the load in small increments, first substep should be in the elastic region.

 
Hi L_K,
i inserted some steps:
step X Y Z
0, = 0, 0, = 0,
1, 0, 125, 0,
2, = 0, 250, = 0,
3, = 0, 500, = 0,
4, = 0, 1000, = 0,
5, = 0, 2000, = 0,

But solution is the same. Bushes with a high stress. :(
 
WB would step the load automatically, it think, unless it was told not to, at which point it would throw a warning.

I think the data is input correctly, but be aware for MISO you're inputting plastic strain.

What kind of plastic? 17000 Mpa is pretty stiff for a thermoplastic unless it is filled with a lot of fiber. An unfilled thermoplastic should be in the range 2200 to 3200 Mpa, unless its an olefin, in which case its even lower. Long glass fiber reinforcement would typically be 10000 to 12000 Mpa. Also, first line of your material data is 0,11. If I'm interpreting this correctly, at zero plastic strain, the stress is 11 Mpa, or about 1600 psi. That is your yield strength which seems awfully low, especially if its filled with the glass fiber necessary to give you that high elastic modulus.

Rick Fischer
Principal Engineer
Argonne National Laboratory
 
What material model for the pin and bushings? Linear elastic? If so, the steel can have a very high stress because in your simulation, it never yields, but the plastic yields and that limits the stress in the plastic components. Also, our stress levels are somewhat similar, except your max stress in the bushing is much higher than mine. Again, take a look at your mesh. if it is coarse, you may be getting contact at just a few nodes on the contact surfaces, and that will drive your stress up.

I think you have problem with your material data in that it doesnt represent your material very well. As an example, I found a 50% GF nylon 6 with E = 16 GPa an Sy = 225 Mpa (this is dry as molded). Your yield strength is 11 MPa. Bilinear and multilinear material curves in FEA are an idealization, and care is needed when taking data values from test data and assigning them to a finite element material model.

Rick Fischer
Principal Engineer
Argonne National Laboratory
 
Hi rickfischer51,
I used for pin and bushings just "Structural Steel NL" got in "Engineering Data" of Mechanical.

I also tried to set for 50& GF "Bilinear Isotropic Hardening", but i didn't have different behaviour.
Immagine_qbn7sk.png

Tangent modulus is given by the slope from first point (Strain 0, Stress 11MPa) and last one (Strain 0.02954, Stress 172 MPa).


According to you is it correct?


Thank you
 
Miso is in terms of plastic strain, but biso is not. The first point in your biso model is (0,0), the second is (11/17000,11). But I think you are missing the point. In your miso curve, the first point is (0,11). The next point is (.00129,60). That means there is plastic strain for any value greater than zero, so 11 Mpa is the yield point in your model. That is way to low for a glass filled polymer. You have inadvertently made your material way too soft.

Rick Fischer
Principal Engineer
Argonne National Laboratory
 
I think your material data is messed up. See the attached plot. I calculated the elastic strain as 11/17000 = .000647, and added that to your plastic strain values, then plotted it. The red line is the elastic response based on E = 17000 MPa. The blue is your data. The orange line is a .2% offset line that is often used to find the yield strength. Note that the slope is increasing above 11 MPa, and is about 38000 MPa, which seems high. That usually doesn't happen, and cant be modeled as Ansys doesn't like increases in elastic modulus. My advise is to get with your resin supplier, tell them what you're trying to do and see if they can help. Also get the tensile test spec (ASTM D638) and read it. You will see that finding a yield value is tricky, and depends on the shape of the stress-strain curve. The way to truly find the yield point would be to load the specimen, release it and measure strain, then increase the load by a small increment and do it again and again until there is residual strain. That last load is the yield strength. But this is time consuming and messy and nobody does this. I think glass filled materials typically use the 0.2% offset value.

Rick Fischer
Principal Engineer
Argonne National Laboratory
 
 https://files.engineering.com/getfile.aspx?folder=a3db1a21-2cbd-4163-9227-fe92eda83a6c&file=engtips.jpeg
Status
Not open for further replies.
Back
Top