There is some debate about relative merits of the power sources. I do think there may be an attempt to put spin on the conclusion from various sides. I'm not convinced I know the full story. But I did try to think through it from some publicly available information. Take it fwiw, I'm not trying to convince anyone of anything (even though I do have an occupational stake in one of these power sources, so I have a reason to be biased if you want to view it that way).
We hear wind lost as a fraction of total lost is small. To my thinking, that shouldn't matter when comparing power sources, what should be relevant is (wind lost as a fraction of total wind) vs (nuclear lost as a fraction of total nuclear) vs (gas lost as a fraction of total gas), vs (coal lost as a fraction of total coal). Also there is some question about the denominator total... should it be total in service at the time or total forecast and more importantly what is the timeframe of that forecast. I've heard some people say wind was high in comparison to forecast, I don't know details of the forcast timeframes they're looking at and how it would compare to the others.
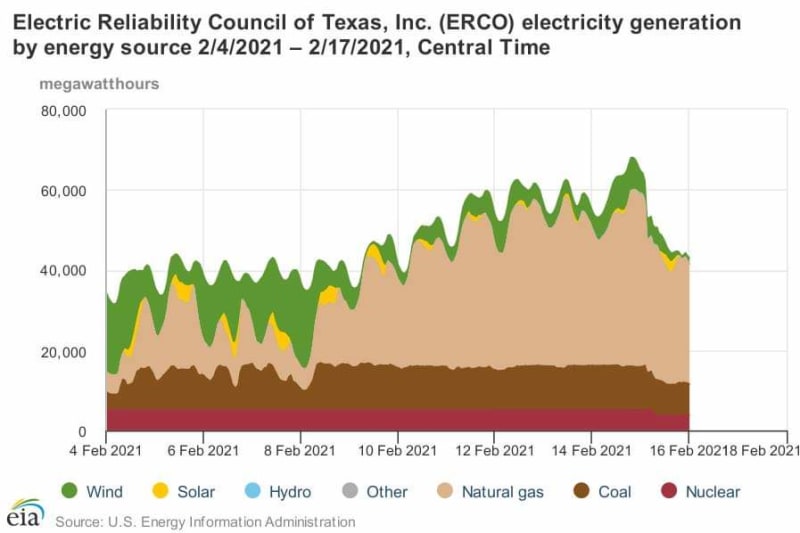
At any rate below I inserted an interesting graph of power vs time during the event from
EIA. You ca look at the power over different timeframes, it's not necessarily straightforward. I'll put some numbers in but there is some subjectivity in that process.
The power sources in the graph are wind, nuclear, gas, coal. It appears coal and nuclear are baseload - they operate at constant load. It appears the wind and solar follow their own daily cycle (not following demand, just putting out everything they can which varies on a daily cycle) and the gas is dispatched in a time-variable fashion to match demand (we have to give gas credit for apparently being the most flexible among these sources).
The fraction of gas lost is (44-33)/44= 25% instantly ~4AM Moonday and (44-26)/44= 38% for the 3-day period M/T/W. Maybe I penalized them too much for starting at 44 which was probably a daily peak but oh well.
The fraction of coal lost looks to be 10% instantly and 30% for the M/T/W period.
The fraction lost of nuclear is exactly 25% instantly and 25% for the M/T/W period (1 out of 4 almost-identical plants tripped early Monday and came back Thursday).
The fraction of wind lost is 0 instantly maybe 40-50% for the three day period from the prior few days average. More importantly it decreased to 0 Monday night which is exactly when it was needed most to my thinking (that was the coldest time in my area of the state).
The fraction of Solar lost is not much but it goes to 0 at night when winter heat demand is highest so it is not helping much in this scenario.

Wind didn't have the rapid change of the others, but it was not particularly the rapid change that caused the problem in this particular event (it could in others), in this event there was sustained deficit of power generation and wind decreased as much or more than any of the other sources during the 3 day period. Abbot's comments were controversial and mostly rejected by the press. I didn't agree with everything he said but i think there's a kernel of truth in there depending on how you slice it. Certainly we know wind and solar are susceptible to weather even outside of extreme events, so it seems obvious the system should not be relying heavily on them. But then in a sense if ERCOT can't depend on their capacity when needed most then they are getting a free ride. In an unregulated environment where wind is already getting huge subsidies, it's part of the landscape to consider when comparing power sources.
I do realize there's a lot of other lessons to be learned and a lot of different ways to compare power sources. Winterization can probably be enhanced for any/all of these types of sources... they operate reliably up north, so they certainly should be able to do the same down south.
=====================================
(2B)+(2B)' ?