Continue to Site

Eng-Tips is the largest engineering community on the Internet

Intelligent Work Forums for Engineering Professionals

  • Congratulations waross on being selected by the Eng-Tips community for having the most helpful posts in the forums last week. Way to Go!

Climate change considered in flood modelling 5

Status
Not open for further replies.

GreenySuz

Civil/Environmental
Nov 19, 2021
6
I need to incorporate climate change into my peak flow calculations when modelling a river to determine the height of a bridge. Are there any practical and exact guidelines as to how it is normally done? Additionally the site is in Africa (data is limited), some specialists increase the freeboard by 0.5 meters but I have not find a specific guideline method to do this.
 
Replies continue below

Recommended for you

It's a bit of a 'turkey shoot', and I suspect the confidence level of future data is pretty low. There are several agencies involved in the estimation of what's coming up... including UN based ones.

Rather than think climate change and the corona virus as science, think of it as the wrath of God. Feel any better?

-Dik
 
I'm not sure if the practice is different in your country but we usually incorporate climate change by adding 10% increase in the Rainfall Intensity.
 
Thank you Naofumi. That is useful information. Where is your country?
 
Si bien he accedido a End Tips desde que estoy aprendiendo a usar SAP2000, también he podido trabajar en Climatología e Hidrología. Es probable que, a diferencia de un embalse, (donde según la incidencia aguas abajo de su sobrepaso, el Código seguramente requiera el estudio de la Crecida Máxima Probable, CMP), en la altura de un puente, pueda ser suficiente una extrapolación estadística de máximos (Gumbel, Log-Pearson III), ej. Tr=200 años.
Sin embargo, comentas que dispones de pocos datos, de manera que esas extrapolaciones, más allá de aproximadamente 2 a 2,5 veces la longitud de la serie de Caudales Máximos (¿medios diarios', ¿instantáneos ?) de que dispongas ya tendrán un error no valuable.
Mi modesta recomendación,-con esa limitación estadística- sería que evalúes ej. las alturas de pelos de agua, para el Q de Tr=200 años y para el Q de Tr=500 años, y dependiendo de la diferencia entre ambas, adoptar esta última.
Respecto de hipótesis de Cambio Climático, en general se parte de hipótesis de calentamiento, que modeladas pueden dar tendencias de lluvias, y temperaturas, pero hasta donde conozco, no he visto que cuantifiquen la mayor severidad de eventos puntuales.
Espero que estos comentarios conceptuales, puedan aportar algo a tu problema. Saludo, Ginés
 
translation?

Rather than think climate change and the corona virus as science, think of it as the wrath of God. Feel any better?

-Dik
 

As I noted, it may be a bit of a turkey shoot... 10% may be inadequate for some areas and excessive for others (maybe -ve value). I suspect there are some areas of western North America where 10% has been greatly exceeded, and maybe a lot more to come.

Rather than think climate change and the corona virus as science, think of it as the wrath of God. Feel any better?

-Dik
 
Hi Dik.

I am looking for numbers, as hydrologist we try and form relationships with data, that is how the TRRL Drainage Manual started, they used UK methods and adapted it to East Africa. When people provide numbers from their specific countries it is useful. To say that there are literature available defeats the purpose of this whole platform where methods and approaches are discussed to help each other. So when you comment please try and state something specific. The comments you are making is very vague and does not contribute at all.

I appreciate the post from Naofumi who actually gives numbers and she is probably also from Africa, which means her numbers will be easier to relate to Rwanda. Regardless of the country try to comment specific numbers so a correlation can be made and then the answer is quite useful. Even if it is from the UK or the US. As you will probably find that is where majority of the approximation starts.

Please do not comment just for the sake of commenting- we all know it changes based on the country and the latest research... When you work in a third world country it is difficult to get data and strategies, it is not as easily available as in the US.

@naomfumi kindly tell me what country you are from.
 
In the coming decades, your current data will likely change. The amount of change will be determined by your location on earth. There are several agencies that are involved in modelling climate change and they would likely be the best source to determine if changes were positive or negative. I understand that some areas of Africa and in the equator area are looking a decreased water. The other part, making the guess more interesting is that the intensities of rainfall will change, depending on where you live. As I said, it's likely a turkey shoot... The comment is to let you know that you should expect that the degree of certainty for your new data, may be very small. I'm not just 'flapping my gums'.

I'm from Winnipeg, Manitoba, Canada.


Rather than think climate change and the corona virus as science, think of it as the wrath of God. Feel any better?

-Dik
 
This is more a matter of public safety and government policy, rather than hard science, in that no one can predict further weather conditions. As such, you're not going to get the specific answers you are seeking. Instead you'll have to rely on local policy guidelines such as "0.5 meter of freeboard" or "10% increase in rainfall". That's all you're going to get.

Peter Smart
HydroCAD Software
 
Even 10% may not be adequate... look at what's happening in British Columbia, Canada at the present time.

Rather than think climate change and the corona virus as science, think of it as the wrath of God. Feel any better?

-Dik
 
Hi Peter

If there were policy guidelines I would gladly follow it. The problem is, there isn't anything. If you have guidelines that indicates such figures (0.5m and 10% increase) please feel free to share. Currently I do not know of anything concrete such as that.

 
This is what Gines said, which I found very useful and can completely relate. I also feel that the current methods overestimates anyways... It would be great to have more hydrologist part of this discussion...

Translated from Google Translate:

Although I have accessed End Tips since I was learning to use SAP2000, I have also been able to work in Climatology and Hydrology. It is probable that, unlike a reservoir, (where according to the downstream incidence of its overflow, the Code surely requires the study of the Probable Maximum Flood, CMP), at the height of a bridge, a statistical extrapolation of maximums (Gumbel, Log-Pearson III), eg. Tr = 200 years.
However, you comment that you have little data, so that these extrapolations, beyond approximately 2 to 2.5 times the length of the series of Maximum Flows (daily means', instantaneous?) That you already have will have a not valuable error.
My modest recommendation, -with that statistical limitation- would be that you evaluate ex. the water hair heights, for the Q of Tr = 200 years and for the Q of Tr = 500 years, and depending on the difference between the two, adopt the latter.
Regarding the Climate Change hypotheses, in general we start from the warming hypotheses, which when modeled can give trends in rainfall and temperatures, but as far as I know, I have not seen that they quantify the greater severity of specific events.
I hope these conceptual comments can contribute something to your problem. Hello, Ginés
 
In the OP you stated that your goal was to "determine the height of a bridge". In that case, the authority that is permitting the bridge would presumably have requirements for the determining the height, including applicable rainfall parameters. In the unlikely event that no approvals are needed, then I would look to the client/owner of the bridge for guidance. In either case this is a policy issue, and not a matter of hard science or engineering, so someone has to decide how much safety margin they want to require and/or pay for. As with all stormwater designs, it's a balance of cost and risk.


Peter Smart
HydroCAD Software
 
uncertainty in hydraulic analysis of rivers and bridges is generally addressed by either increasing the freeboard or designing for a design storm with a higher recurrence interval. For example, using a 200- or 500-year storm instead of 100-year. much easier to defend this design basis than using some arbitrary percentage increase in rainfall intensity.
 
GreenySuz said:
I need to incorporate climate change into my peak flow calculations when modelling a river to determine the height of a bridge. Are there any practical and exact guidelines as to how it is normally done?

...I have not find a specific guideline method to do this.
...The problem is, there isn't anything.

I am looking for numbers...

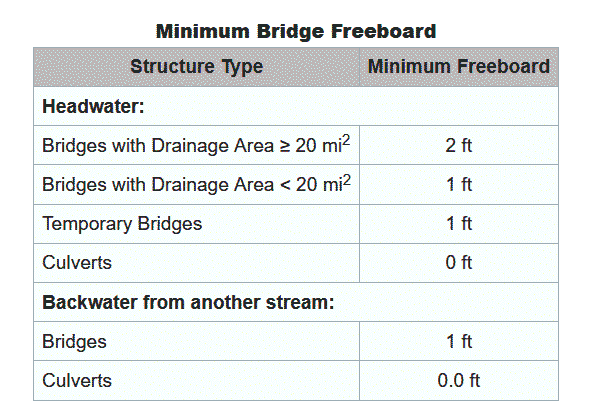
You are not getting results because you are neither using the correct term (called "freeboard") nor asking in the best place ("Bridge Engineering" forum).

Bridge_Freeboard-591_evdfms.png


This info is from the "Missouri DOT Engineering Policy Guide", Paragraph 7.48.3.5. There are probably alternate recommendations from other agencies that are responsible for bridge design.

 
Hi SlideRuleEra Climate change influence on the bridges height (freeboard)... not just the normal freeboard. This is a hydrology question which is also used in flooding and storms rather than just a bridge focused question.

Thanks cvg I was looking for something more concrete once again an actual guideline that mentions what you are mentioning.

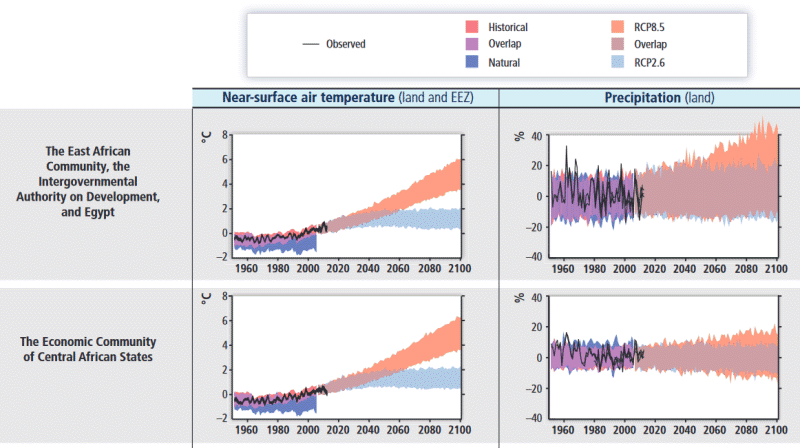
For future engineers in need of information I looked at the statistical climate change of the past years and the closest I could get to Rwanda was Tanzania, Kenya and Uganda's Climate Change report- I attached the report on Kenya.

Just a note Peter there are no guidelines by the authorities that is why I asked the question. In fact they asked me how I will consider it. Thanks anyways.
 
 https://files.engineering.com/getfile.aspx?folder=4d04e01a-c249-4bb6-95d8-3165240c3faa&file=Kenya.lowres.report.pdf
Para GreenySuz:
Es claro que has estado investigando muchísimo el tema.
Sugerencia: si no lo has hecho aún, intenta consultar en el SEI (sei.org) de Estocolmo, si han llevado a cabo algún estudio que se relacione con tu pregunta inicial y con el paso de tiempo que requeriría una crecida.
Me ha tocado participar en el análisis de resultados de modelaciones (no del trabajo de producción en si mismo) de un caso de evolución de afluentes por incidencia del CC, pero a paso Decadal (Delta t = 10 años), o sea no aplicable en tu caso. Saludo, Ginés
 
Sorry for the late reply, I'm from the Philippines but our practice is based on IPCC (Intergovernmental Panel on Climate Change) recommendations from United Nations.
 
Status
Not open for further replies.

Part and Inventory Search

Sponsor