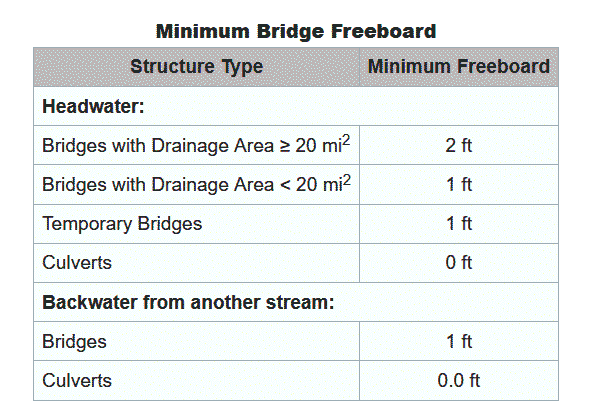
I need to incorporate climate change into my peak flow calculations when modelling a river to determine the height of a bridge. Are there any practical and exact guidelines as to how it is normally done? Additionally the site is in Africa (data is limited), some specialists increase the freeboard by 0.5 meters but I have not find a specific guideline method to do this.
Tek-Tips is the largest IT community on the Internet today!
Members share and learn making Tek-Tips Forums the best source of peer-reviewed technical information on the Internet!
-
Congratulations cowski on being selected by the Eng-Tips community for having the most helpful posts in the forums last week. Way to Go!
Climate change considered in flood modelling 5
- Thread starter GreenySuz
- Start date