Continue to Site

Eng-Tips is the largest engineering community on the Internet

Intelligent Work Forums for Engineering Professionals

  • Congratulations cowski on being selected by the Eng-Tips community for having the most helpful posts in the forums last week. Way to Go!

In practice how do people consider EC2 parabolic stress block 1

Status
Not open for further replies.

Agent666

Structural
Jul 2, 2008
3,080
Hi All

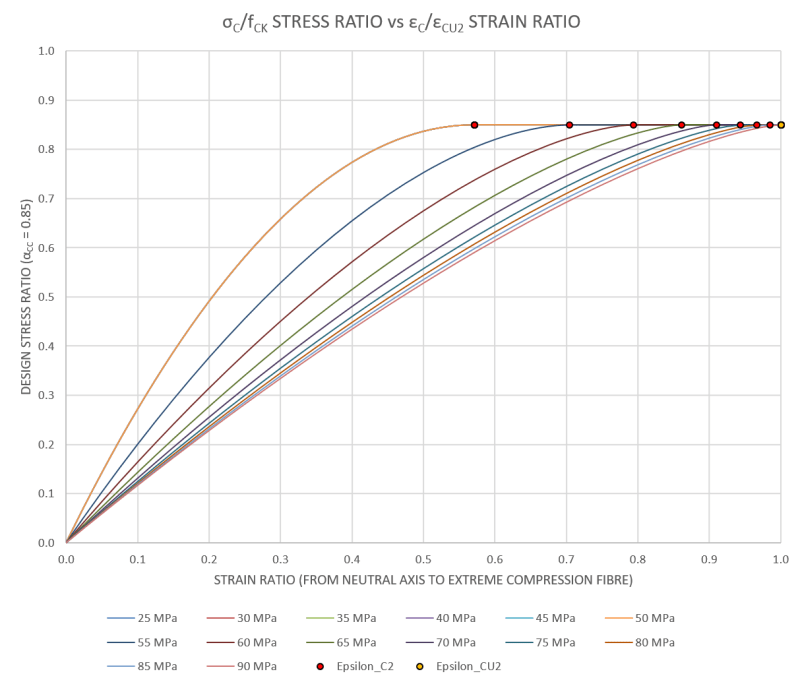
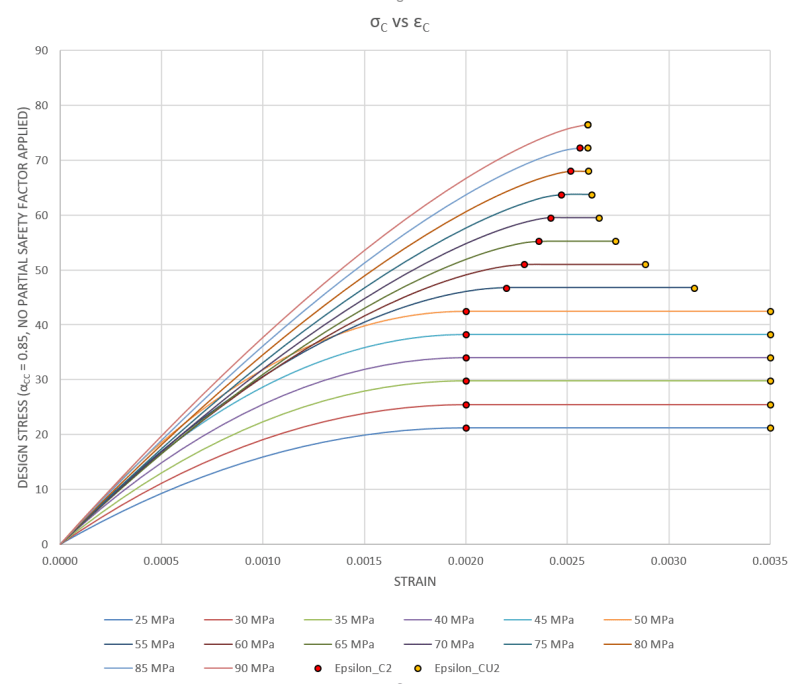
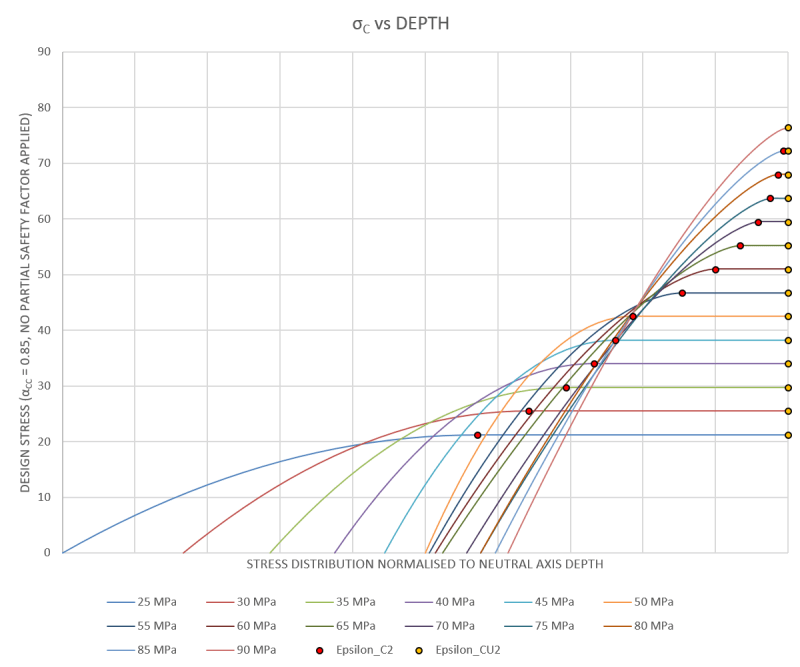
Couple of questions about how people deal with the EC2 parabolic-rectangular (or any other non rectangular) compression block in practice/practical design, especially when dealing with non-rectangular sections or bi-axial bending where the width of the block is changing with respect to depth from the extreme compression fibre:-

Untitled_d0zjl2.png


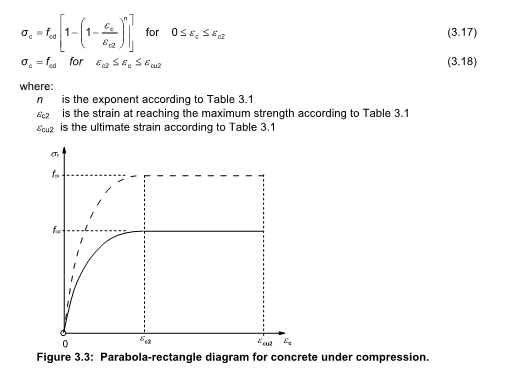
For a rectangular section (i.e. beam) with flexure about one axes only, its quite easy to resolve the parabolic distribution to an equivalent rectangular stress block for the purposes of calculating the ultimate capacity of a section, i.e. same area and centroid via integrating appropriately the 3.17 equation in EC2.

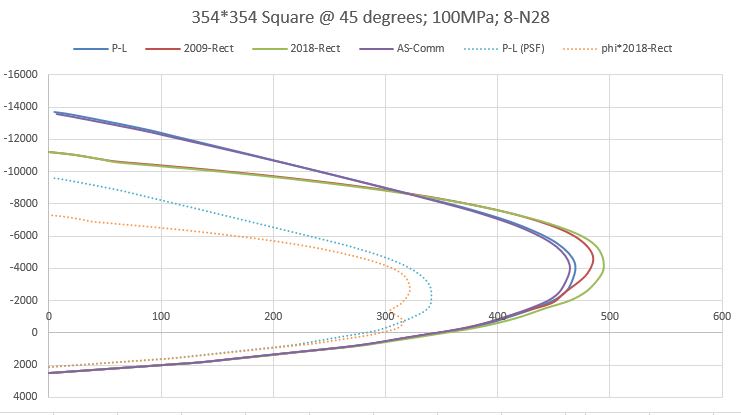
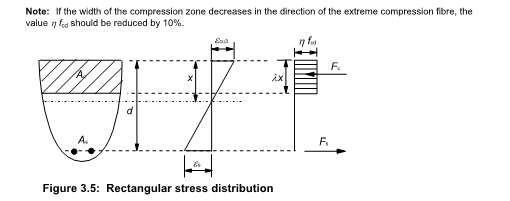
This only works for rectangular sections with one principle axes moment. For anything non rectangular (say a circular section), or bi-axial bending in a rectangular section (i.e. column), do people typically just use the rectangular stress block from EC2 and apply the 10% reduction to η (the reduction in f_ck) noted in clause 3.1.7(3) and not 'go there' with the parabolic curve as it all gets too hard.

Untitled_smqj91.png


If doing things by hand I'd simply do it this way as its close enough for ultimate capacity, but for spreadsheets you can obviously go to the effort of working things out using the parabolic or bi-linear relationship and apply the EC2 parabolic distribution to the non-rectangular section and work out the area and centroid (presumably need to integrate the 3.17 relationship over the curve and the section shape (i.e. find the volume and centroid of the resulting 3D stress block in the section).

I can't imagine this is too hard, though my integrating skills were put to the test just doing the 2D problem for a rectangular section, and have never attempted finding the centroid and volume of a 3D shape like this!

So how do people deal with this in practice, we are told these more advanced curves are better/more accurate, etc, etc... but is it all just too hard to do in practical design unless you are using some software that already does these things for you?

Also is anyone aware of any generalised solutions for the volume and centroid of the parabolic-rectangular stress block for 1) circular or 2) rectangular sections with biaxial actions?
 
Replies continue below

Recommended for you

Rectangular stress block from AS3600-2018.
Curve from 2014 commentary on AS3600-2009.

2018Rect_bgh23n.jpg

2014Curve_mfsyuc.jpg

2014Graph_xtlmuy.jpg
 
steveh49, looking at your plots again, your EC2 curve should also stop at the max strain for a given concrete strength (instead of carrying on horizontal to 0.0035), 80MPa curve should stop at εcu2 = 0.0026 for example. Does the AS commentary one might also have some limiting strain like EC2 that is lower than the 0.0035 plotted (guessing whoever is kind enough to post the AS commentary curves will clarify that aspect for me Thanks steveh for posting as I was writing this reply!)?

Many different ways to express the same thing on the assumption of a constant neutral axes depth for illustration purposes, first one probably best shows whats going on conceptually with increasing concrete strength and the stress distribution. Once I look at some real sections I'll get a feel for the variation in neutral axis depth and can plot the true design stress distribution for varying concrete grades for a given section (i.e. 0,0 point will likely change based on strength):-
Capture_t6o1vi.png

Capture_bxismb.png

Capture_cq0i62.png


rapt said:
Except for ACI which does not qualify to use of the .003 limit so we use the .003limit for ACI.
Not sure I'm following what you mean by this? NZS3101 was loosely based on the ACI code and contains a statement along the lines of max strain at ULS shall not be greater than 0.003 for design. So I suspect any limitations you mention may also apply, and I'm trying to understand how this might be applied in practice, if its required to be considered. Can you expand on what you meant or how you deal with the upper limit of 0.003 vs perhaps 0.0035 in implementing the EC2 curve with the ACI code.

Edit - do you mean you chop it off early at a strain of 0.003, and don't consider the gain in strength above this point in going to a strain of 0.0035 for design when considering design to the ACI code?
 
Looking at the Australian commentary curve, I'd be hesitant to use it for anything but Australian concrete as it's implied as being quite specific to Australian concretes based on some of the contributing factors. Still, interesting to compare at least.
 
I have written a spreadsheet that performs a "plane sections remain plane" analysis of an arbitrarily shaped and arbitrarily reinforced concrete cross-section.[ ] The stress-strain relationships of both the concrete and the steel can also be completely arbitrary (defined by a piecewise-linear relationship), and the loadings can be any combination of axial load and biaxial moment.

It is not the sort of tool you would use for everyday analysis or design, but it might be useful to quantify the differences that result from some of the different assumptions discussed above.[ ] The spreadsheet can be downloaded from my web site (
 
Denial, thanks for sharing, looks pretty comprehensive. I had an earlier version of your work stored away in my spreadsheet folder from when I must have randomly come across your website sometime in the distant past (v3.03).

FYI, when opening the latest version I get an un-handled error (run-time error '91': Object variable or With block variable not set), on the following line immediately after enabling editing and disabling Excels 'protected view'
In Workbook_open module said:
ActiveWorkbook.Protect Structure:=True, Windows:=False, Password:=PsWd
Doesn't seem to occur again once its trusted by excel for editing on subsequent openings. Try copying and pasting the file itself and opening a fresh copy to reset the protected view status and see if you see the same thing occur.

Here's a visualisation of the actual stress distribution for a rectangular section with the EC2 stress block subject to the same compression force (same area under the curve) with varying concrete strengths.
Capture_z7d5rz.png
 
Agent666,
AS3600 requires that the compression reinforcement strain not exceed 0.003 (clause 8.1.2).

Agent666 said:
its actually pretty hard to compare anything but the capacity achieved and resulting reinforcement stresses.

Hasty modification of my spreadsheet to include rectangular stress blocks. Hopefully no errors introduced while doing that. The details are:
[ul]
[li]354 x 354mm square section, rotated 45 degrees (aka equal biaxial moment that Rapt mentioned earlier)[/li]
[li]8-N28 bars (one each corner and one middle of each side)[/li]
[li]100 MPa (first image) or 32 MPa concrete.[/li]
[li]Peak stress is 0.9*f'c for the P-L and AS-Comm curves per AS3600 requirement.[/li]
[li]10% reduction for cross-section getting narrower toward the compression edge hasn't been applied.[/li]
[/ul]

The odd dimensions and heavy reinforcement are because I forgot I need to enter the diagonal dimension rather than side dimension for this 'diamond' cross section. I meant to do a 500*500mm section. 3.9% reinforcement is just under the limit so 354mm is a valid cross-section still.

For 100MPa concrete, the ultimate interaction curves for rectangular stress block go outside the P-L curve. AS3600's safety factor (phi) is however more conservative than EC2's partial safety factors (PSF) in this case, so the rectangular design curve falls inside and is more conservative than EC2 even without the 10% reduction due to cross-section narrowing. I think also that this PSF curve is a little conservative compared to an EC2 design as I've included the maximum 0.9*f'c requirement from AS3600 that I don't think EC2 requires. (?)

For 32MPa concrete, the ultimate curves for rectangular stress block are inside the P-L curve. I didn't bother doing the phi*ultimate and partial safety factor curves as I expect that a similar result to 100MPa would be the result (ie rectangular stress block design to AS3600 gives lower capacity than EC2 P-L design).

100MPa-Interaction_ysigrz.jpg

32MPa-Interaction_f58ack.jpg
 
Here's what I should have done first, but I was selfishly wanting to add Australian requirements to my spreadsheet.

These graphs are pure EC2 (to the best of my knowledge - I don't use it for design), except the 10% reduction for narrowing cross-section isn't used for the rectangular case. For the parabolic-linear curves, the peak stress is taken as fck.

EC2-100MPa_rvyz3h.jpg

EC2-32MPa_ffpee1.jpg
 
For the UK at least, the alpha_cc factor is 0.85 in the national annex, I guess this is comparable to the 0.9 reduction in AS3600 to f'c. F_cd = alpha_cc*f_ck, unsure how other European national annexes treat this factor, whether they accept the EC2 default of 1.0, or call-up a different lower factor.

Interestingly in NZ the strength reduction factor is phi = 0.85 for all actions (axial [tension or compression] with flexure), EC2 equivalent is 1/1.5 = 0.6667. So you've got a huge variation in capacity right there to start with, probably more than taking different comparisons of stress blocks.
 
Agent66,

No, EC2 is 1/1.5 for the concrete forces only. It is 1/1.15 for the steel forces. This logic automatically allows for reduced capacity for cases where concrete compression dominates and the section is not ductile

Doesn't NZ code reduce phi as compression/ductility dominates as ACI and AS3600 do? AS3600-2008 used .8 for ductile reducing to .6 for very over-reinforced. 2018 uses .85 reducing to.65
 
Nope, it's 0.85 for everything. We do have higher confinement requirements as far as I remember when compared to ACI, perhaps as a tradeoff.

 
Agent666.[ ] Thanks for letting me know about that quirky behaviour of my spreadsheet.[ ] I have tried unsuccessfully to reproduce it:[ ] maybe my Excel knows my spreadsheet a bit too intimately.[ ] But then the problem you report comes from a section of code that I include in all my spreadsheets, and I have had no other reports of this behaviour in any of them.

I am using Excel 2010 under Windows-10 64 Bit (Home edition).
 
Denial - I wouldn't be bored by a discussion of Excel interface problems at all. Maybe a new thread in the spreadsheets forum might be an idea though.

Doug Jenkins
Interactive Design Services
 
With a lot of help from Agent666 I have got to the bottom of the error he describes above (21Oct18@02:16), and have made changes which I believe will prevent its recurrence.[ ] The problem seems to have been related to code attempting to be executed before the page was ready, in particular when the spreadsheet opens in protected mode.

At the same time we (Agent666 and I) fixed a couple of minor errors.

The updated version is now available for download.
 
Hey OK so I'm finally writing back. I've turned my old thesis into a course on my continuing education website. There it can be downloaded for free by anyone interested in reading it. Keep in mind I'm not at all familiar with Australian or New Zealand codes. It was written back in 2003 so it does not include I'm sure the latest and greatest stress-strain curves.


The course (my old thesis) is a bit disjointed now that I read it 15 years later. That is because when writing it I was more interested in the use of nonlinear stress-strain curves and the effects of casting position versus my professor who was more interested in the numerical procedure used by the FDOT program and largely written by him. He was and is much smarter than me and the program is truly impressive. And yes it can analyze any shape for biaxial loading.

A few notes about the course. It basically covers three topics

1) the numerical procedure used to analyze columns for biaxial bending. The best part is that as an engineer if you know the three forces applied to the column (axial, Mx, and My) you can easily look up the load point on a constant load - moment interaction diagram and see exactly how it compares to the three-dimensional failure surface. I recommend always using 32 or more iterations.

2) nonlinear stress-strain curves and the rectangular stress block and their significance and importance. It is clear that the shape and accuracy of the stress block is less important with beams and very important with columns.

3) The k3 factor. This is a factor that researchers use to adjust for the difference between the in situ strength of concrete and the value predicted by breaking reference test cylinders. There are many factors which influence this. But the most important one and the one LOST to history and sometimes even in research is casting position. The higher the concrete pour lift height the more hydraulic lift of water occurs and the more the concrete strength varies throughout a vertical member. When doing my research it was interesting how some researchers were very much aware of this and how others were not or even improperly accounted for it. You won't see the factor used in ACI for beams. But you will see it used for concrete columns.

Again this is sort of lost history and you will only see the factor called by it's true name in research.
So here is the maximum axial load for a tied concrete column per ACI.

Phi*Pn = 0.85 * phi *(0.85f'c(Ag - Ast) + Ast*fy)

The 0.85 factor next to the f'c is the mysterious k3 factor talked about in my paper. This factor was I believe from Hognestad's early research on column behavior and it accounts for the fact that most columns are vertically cast and hence suffer from hydraulic lift.

Speaking of hydraulic lift I remember even reading a paper that hydraulic lift even effects the reference test cylinders. For those that have cast a cylinder in a matter of minutes you'll see water pooling at the top of a cylinder. So cylinder breaks will pretty much accurately predict concrete strength for shallow cast members. But when you are talking about 4 foot lifts they will be unconservative.

It is important in my opinion that when applying nonlinear stress strain curves to your analysis that this factor be included right off the bat and into the shape of the curve. This is because unlike the rectangular stress block (which is purposefully conservative) using nonlinear stress-strain curves will produce nearly exact results for regularly sized columns. So if concrete strength is overestimated you will be WRONG by 8 to 15% which is not insignificant when designing compression members.

For those deeply interested in the subject I really recommend reading some of Hognestad's published literature. His research was very well done and he unlike many was using more reasonably sized columns. You will even notice in my paper that a lot of the research I reference is on 4 in by 4 in columns. You will also notice the results have a higher standard deviation.

Hognestad did his research on larger more reasonably sized columns and the modern stress-strain curves do a very good job predicting behavior when comparing them to his research.

I apologize in advance for any spellling errors or other gramatttttical errors. I'm tired and do not care to proof my post.


John Southard, M.S., P.E.
 
Agent66,

I have been on holidays and missed your question above about .003 and NZS.

RAPT does not have a NZS code option so it not have any settings for it.

The default option for ACI is to terminate at .003. If a designer wishes to they can adjust it to the full Eurocode Curve and variable limits from.0035 to .0028.

 
Thanks southard2 and rapt for the replies.

No problem on the late reply rapt, to be honest I thought about it some more and came to the conclusion that you could only mean truncating the EC2 curves at a lower strain of 0.0003 when they went over this. For some reason initially I had it in my head I should be scaling the curves rather than just using everything as it is below 0.003 strain.

southard, interesting regarding the k3 factor, NZS3101 has the same 0.85 factor in front of f'c. But I'd never thought about the exact reasons before or known what it represented, it was just some mysterious fudge factor previously.

Thanks for the copy of your thesis, I was going about dividing the section in a similar manner by slicing it parallel to the neutral axis, but I was assuming if the depth of the slice was small enough that the width and change is stress would be near linear so was simply slicing the section into lots of very thin slices and calculating the volume of stress and centroid knowing the relationships for the resulting shape of the 'volume' representing the stress distribution. However to reduce error I obviously need to slice it quite finely.

But I can see using Simpsons method (which I had completely forgotten even existed until I did some googling on how it can be applied to finding volumes) will significantly cut down on the computations involved in finding the force acting on a slice. As long as I can work out how to also use Simpsons method for finding the centroid of the forces on each slice of the section to work out the resultant force location for a given section geometry and stress distribution.
Some more fun googling and I'm sure I'll figure that out, just a matter of finding a relevant example of someone else doing it to make sure I'm understanding how to apply the integrals in finding a centroid (if you have any examples or the method used it will be most helpful).

 
Status
Not open for further replies.

Part and Inventory Search

Sponsor