Continue to Site

Eng-Tips is the largest engineering community on the Internet

Intelligent Work Forums for Engineering Professionals

  • Congratulations KootK on being selected by the Eng-Tips community for having the most helpful posts in the forums last week. Way to Go!

Oroville Dam Spillway Concrete Failure (Feather River Flooding, CA) 36

Status
Not open for further replies.

msquared48

Structural
Aug 7, 2007
14,745

Erosion has created a 300-foot-deep hole in the concrete spillway of Oroville Dam and state officials say it will continue grow.
State engineers on Wednesday cautiously released water from Lake Oroville's damaged spillway as the reservoir level climbed amid a soaking of rain.

Situated in the western foothills of the Sierra, Lake Oroville is the second-largest manmade reservoir in California after Shasta....

Member Spartan: Stage storage flow data here for those interested:

Mike McCann, PE, SE (WA)
 
Replies continue below

Recommended for you

Where is it showing sub-zero flows? The upper left graph is the inflow into the reservoir, and the upper right is the outflow. The inflow is is around 16,000 cfs, while the outflow is around 1,750 cfs. The lower right graph shows a slight increase in total stored water, as expected.

TTFN (ta ta for now)
I can do absolutely anything. I'm an expert! faq731-376 forum1529 Entire Forum list
 
I don't know about mining being flat, as it is not flat here. But then again it is mostly just rock for construction, which is local.
 
IR said:
Where is it showing sub-zero flows?

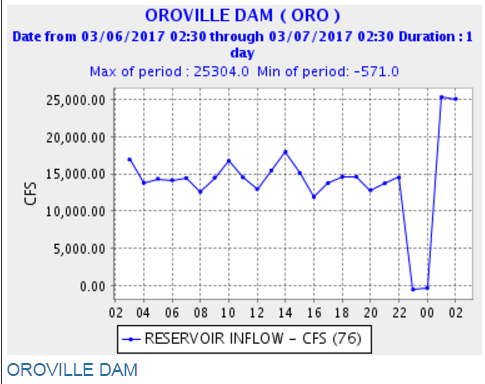
It's not anymore. There was one day about 4 days ago that was about 200cfs BELOW ZERO. The vertical
auto scaling actually went to zero and the data point was below that.

Odd.

Keith Cress
kcress -
 
My guess is that any sub zero flow information is just noise in the instrumentation.
 
Or, could be the effect of some kind of tide. A bit hard to imagine but maybe, just maybe.

Posting guidelines faq731-376 (probably not aimed specifically at you)
What is Engineering anyway: faq1088-1484
 
Pitt lake in British Columbia is unique in that it is a fresh water lake but it is tidal. When the tide comes in, the Fraser river backs up and forces the Pitt river to run backwards and raise the lake level.
A friend and I discovered this in the middle of the night when we were camping on a beach. We woke up just in time to avoid getting our sleeping bags flooded.
Not so sure about Oroville lake.

Bill
--------------------
"Why not the best?"
Jimmy Carter
 
If the river below the dam backed up into the lake (reservoir) 800+ feet above, then it'd probably be on the news. :)
 
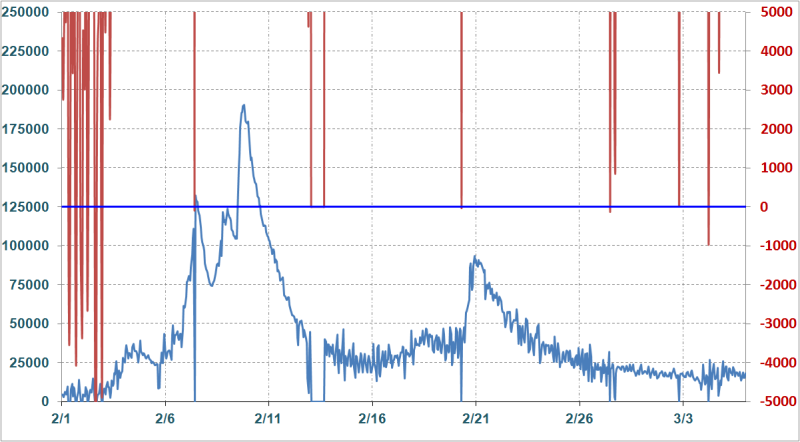
The "sensor" data is extremely noisy, so it's basically just noise. See below:

inflow1_bay1xi.png


TTFN (ta ta for now)
I can do absolutely anything. I'm an expert! faq731-376 forum1529 Entire Forum list
 
Anyone have info on the reconstruction plan, if any. The shotcrete work at the overhang above the failure would appear to me to be just a temporary bandage in case the spillway has to take some water soon. Considering this dam probably has an infinite expected usable life, spending bucks now would conform with the typical engineering approach as on other jobs. Maybe politics will override that.
 
I took a look at the inflows and outflows in the link posted in my original post in this string and noticed something odd. The inflow is less than the outflow yet rhe reservoir is rising.

Seems like this is evidence that their hydrologic model is off.

Mike McCann, PE, SE (WA)


I don't see comments related to cavitation as a likely cause for the spillway failure, but the ChicoER had an article back on 2/16 that mentions it (link below). The reverse camber of the spillway just seems wrong to me, as it creates an accelerating profile for the water flow, creating ideal conditions for cavitation bubbles to form. Since about 50 years ago, stepped spillways and other aeration schemes to mitigate cavitation have been incorporated in spillway designs, but never got retrofitted to this one? I've seen other spillway channels in California with the big block-shaped aerators spaced all along the channel slope, dunno why that could not have been done on the Oroville spillway.

 
I find Itsmoked's attachment to the latest Youtube videos fascinating. Certainly gives a good overview of the scale of construction taking place today. Megamillions of $$$$$$$ for sure and even allowing for the emergency nature of the repairs , probably not that much money being wasted. However my immediate thoughts are " Which engineering group was able to get their act together so quickly to generate recommended repairs?". I'll guess that the necessary approvals came quite quickly as the consequences of procrastination mustve been evident , even to non engineers , early on. Would this have been the US Corps of engineers or a private group??
 
I posted an article back on 24 Feb 17 14:58 which suggested that cavitation could be the cause of the spillway failure. However, at least one person here took issue with the item suggesting that it was "highly questionable" due to it having being written by a "non-professional", that is a person who appeares to be the science-reporter for 'The Mercury News', a Bay Area newspaper.

John R. Baker, P.E. (ret)
EX-Product 'Evangelist'
Irvine, CA
Siemens PLM:
UG/NX Museum:

The secret of life is not finding someone to live with
It's finding someone you can't live without
 
Looking at the flows:
[URL unfurl="true"]http://cdec.water.ca.gov/river/res_ORO.html[/url]

It looks like they've got all the turbines (one is removed for repair) running today.

And. That means they can drain the dam faster than the inflow without using the main brokenway.

And. They cut it realllly close to their quasi-arbitrary 'we shall not exceed 860 feet' level, or 'we would have to use the spillway'.

This will mean the sheriff's "I won't lift the warning until this list of conditions has been reached" list
is, I believe, now covered.

Keith Cress
kcress -
 
I took a look at the inflows and outflows in the link posted in my original post in this string and noticed something odd. The inflow is less than the outflow yet rhe reservoir is rising.

Seems like this is evidence that their hydrologic model is off.

I don't understand how they even have a semi-real-time inflow figure for this reservoir. It has at least four major inflow arms and countless minor streams, all of which are flowing significantly after the frog chokers they have experienced all winter. There can't be stream gauges on all of them, so they are either leaving them out (which would account for the unexplained increase) or guessing at them, and possibly getting them wrong.
 
It looks like they post the immediate flows but that they are eventually corrected somehow. Really
large ones and negative ones appear then disappear. Probably a human checking and adjusting the
horribly noisy data IR showed us back a few days ago.

John; On a billion dollar reservoir I can easily see multiple flow meters on even the tiniest contributor.
They also have the absolute final word via the reservoir depth and the fact that they probably have very
accurate outflow sensors. That probably allows them to correct any inflow flyers confidently.

Keith Cress
kcress -
 
Status
Not open for further replies.

Part and Inventory Search

Sponsor