I have prepared a break down of the failure surfaces and explain them with the following sketches.
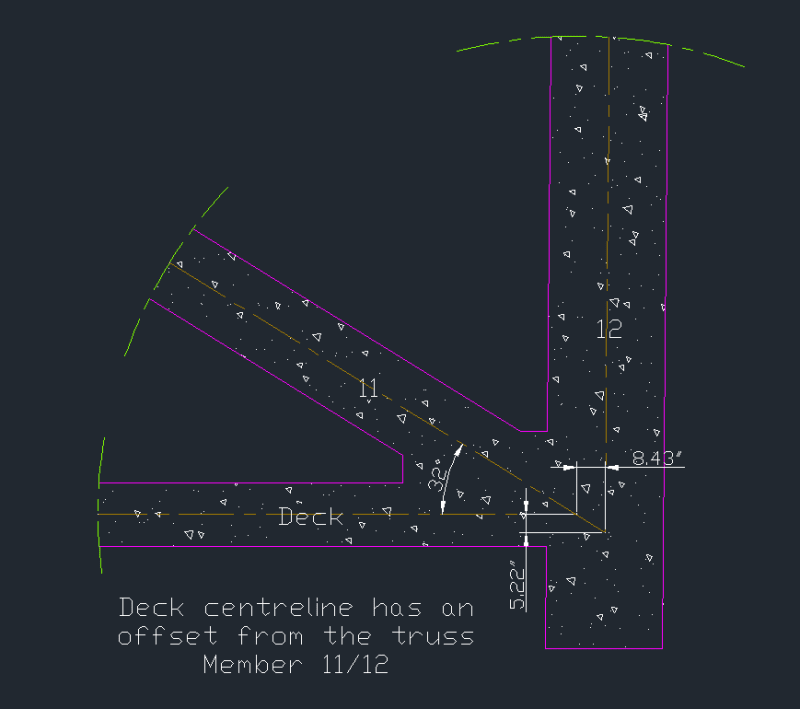
The center line through the truss/bridge should look like the sketch below.
Fig-1 Deck center line not meeting center line of 11/12
An interesting feature is the deck does not join the centers of 11/12. It eventually broke off from Member 11 leaving 11/12 substantially as one entity despite serious spalling at the joint.
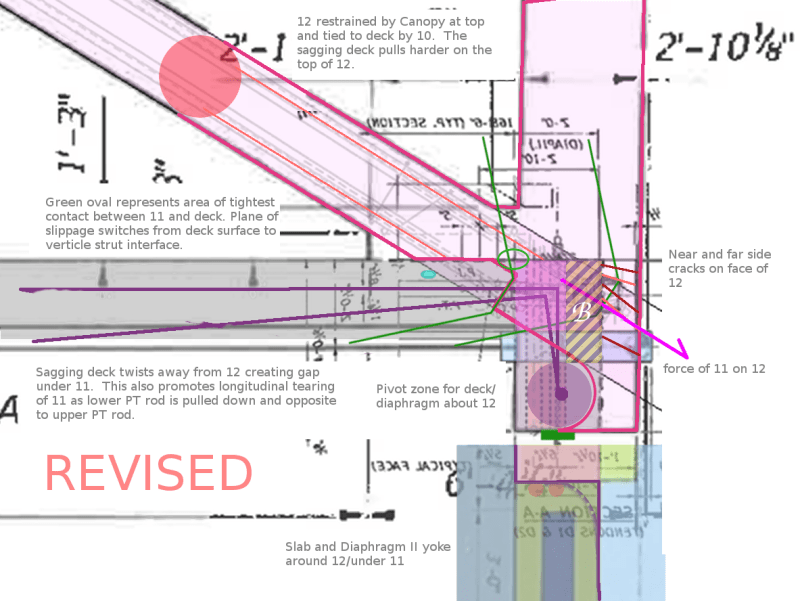
I then looked at how the deck was bonded to 11/12. This is shown in the sketch below.
Fig-2 slid CJ altered the internal resistance pattern of the deck/11/12 joint
Area C is deck only. One can say the deck could be bonded to 11/12 by one vertical interface between Area A and Area C plus two side interfaces of Area A+B with 11/12.
FIGG is his Mar 15 presentation had assumed the Area A to be triangular but I have assumed it to be rectangular here. The shape doesn't matter because we all know now the construction joint (CJ) slid and so any concrete bonded to the two sides of 11/12 would have been irrelevant and so is the shape of Area A. The resistance would then be transferred to the surface D, the interface between the north edge of the deck (in AREA A) with the south face of Member 12 (Area B). Area A therefore had no shear failure and remained part of the deck even after the collapse.
The concrete bond from the deck with the two sides of Member 12 is therefore left to Area B which is the same full cross section as Diaphragm II.
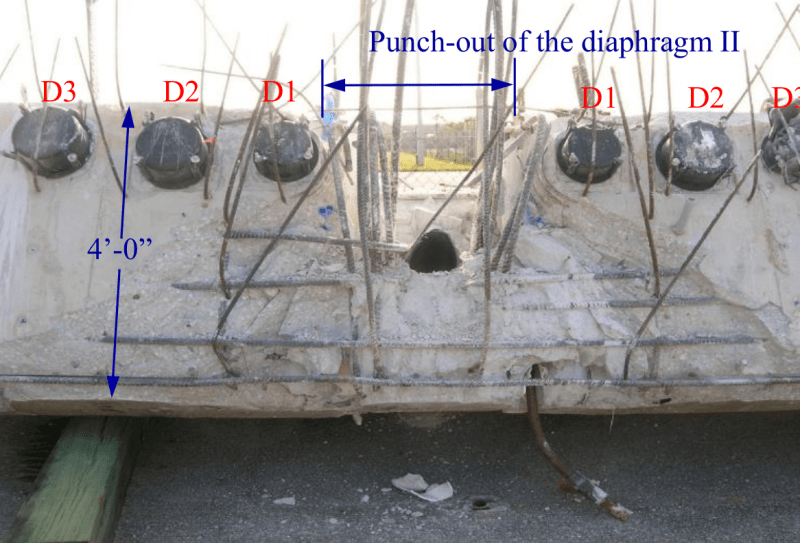
However as I have pointed out FIGG's designer had chosen to put 2 No. of 4" ID vertical sleeves and one 8" ID horizontal pipe at this critical location to weaken the joint dramatically. The consequence is shown in the next sketch.
Fig-3 side shear resistance of 11/12 significantly compromised by the embedded sleeves and pipe
The Area A was divided into three vertical strips of 3", 2.25" and 9.75" wide. The first two were too flimsy and would break quickly when they were pressed against the flexible sleeves.
The 8" horizontal pipe occupies 40% the concrete sectional area. Thus the section with remaining 60% area became the weakest plane against the horizontal force. I denote this failure surface as Area E. It has two strips each with 30% of the original area on either side of the pipe.
These two strips now form Area B1 which has 17.3% of the original section area of 24" wide by 40.5".
I summarize each available failure areas or surface, including the easily broke area B2 and B3, by the last sketch plus a spread sheet showing their dimensions and the likely resistance by concrete, rebar and clamping force.
I have labeled the failing surface starting from CJ as a, b, c, d and e. The two sides area now have B1, B2 and B2 for completeness.
Fig-4 Details of failure surfaces and areas
The above sketch is relevant if we want to assess why the two PT rods could have different strains when the same tension force was use in tension and de-tension.
Fig.5 A tabulation of the failure surfaces/areas
The use of this spreadsheet is for us to examine what rebar crossing each failed area or surface and sum the total shearing resistances to prove if the joint was strong enough against the collapse.